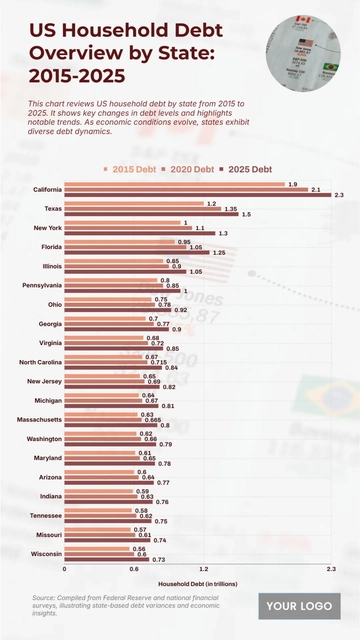
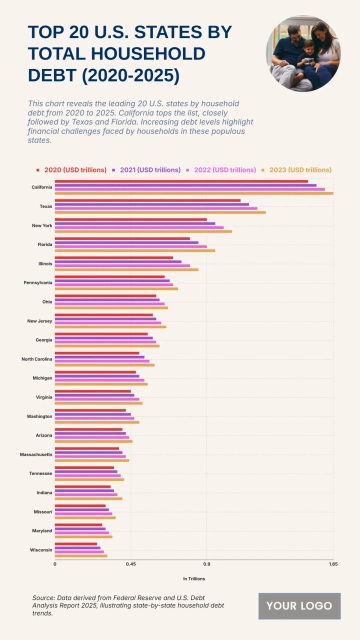
Top 20 U.S. States by Student Loan Debt per Capita (2018–2025) Template to Edit Online

An informative 9:16 infographic chart for comparing student loan debt per capita across the top 20 U.S. states, professionally designed by Template.net, with a grouped bar chart, a circular book photo and a summary paragraph in dark red, orange and teal.

Customize it in two ways:

  • Editable with AI Replace the logo in [logo_image] with [Upload image], and replace the text with [text_input], change to relevant elements while keeping similar style, composition and background.
  • Easily edit it manually: customize the content, elements, photos, colors and fonts.

Free Top 20 U.S. States by Student Loan Debt per Capita (2018–2025) Template

By Template.net

Open Editor
Infographics Generator