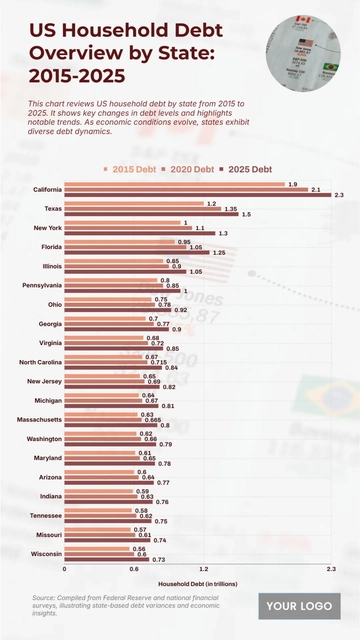
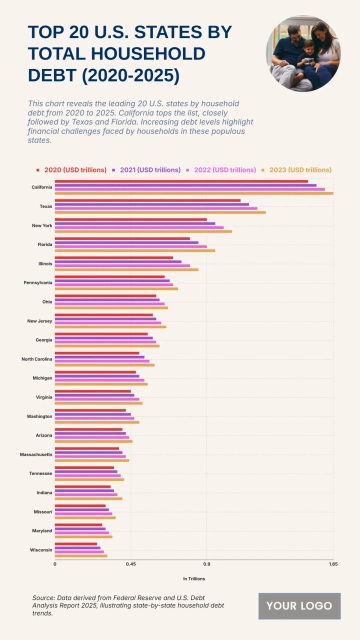
An informative 9:16 infographic for comparing student loan debt across U.S. states from 2015 to 2025, professionally designed by Template.net, with a grouped bar chart, a round graduate photo and a source note in cream, coral red and soft purple.
An informative 9:16 infographic for comparing student loan debt across U.S. states from 2015 to 2025, professionally designed by Template.net, with a grouped bar chart, a round graduate photo and a source note in cream, coral red and soft purple.