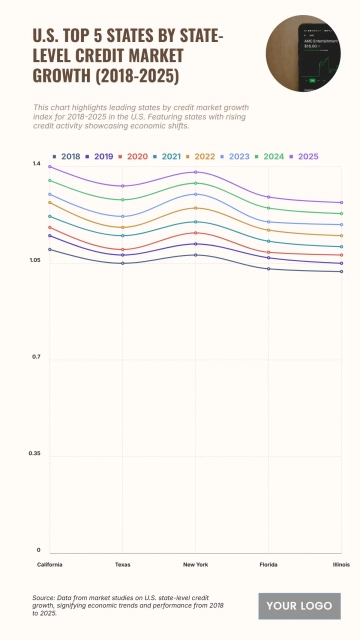
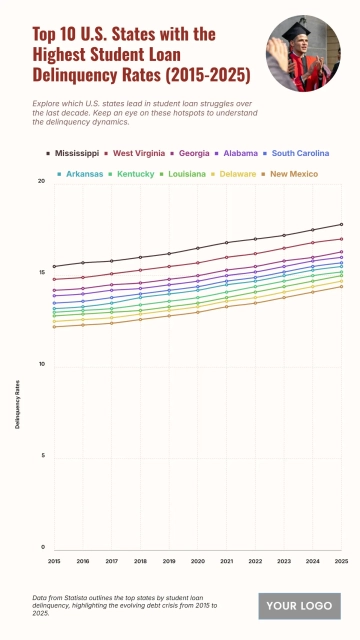
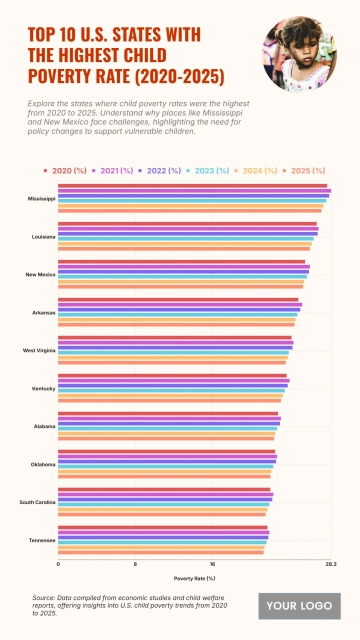
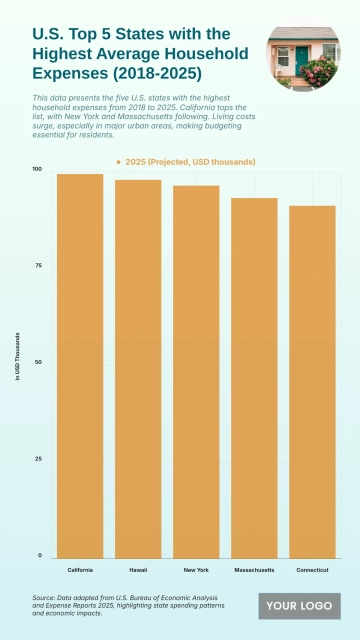
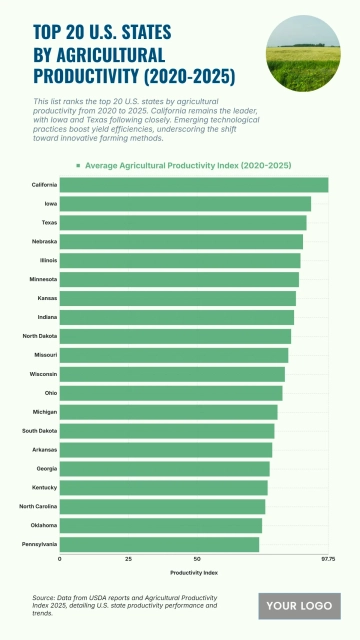
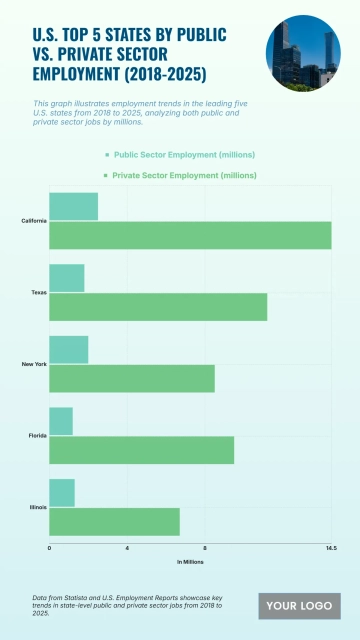
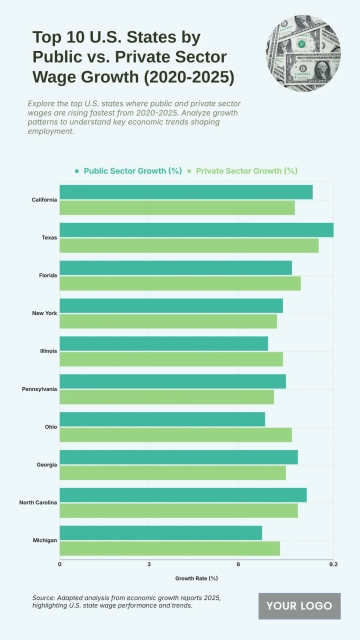
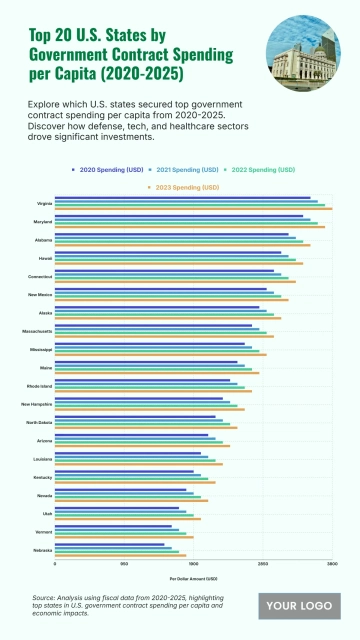
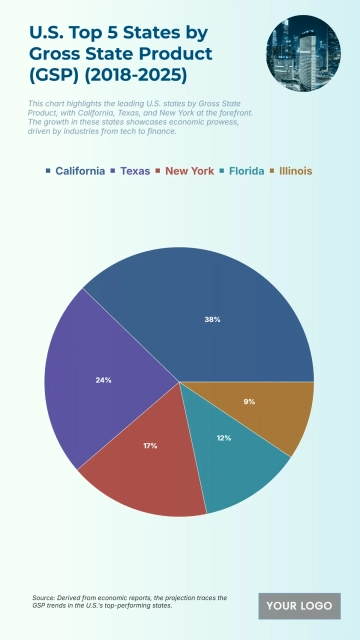
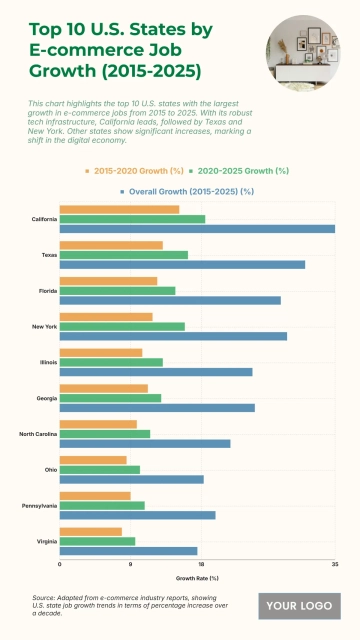
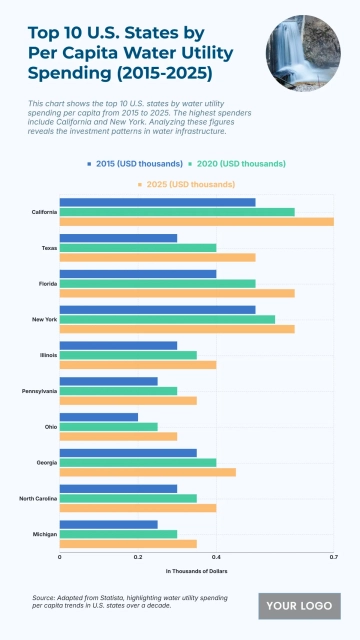
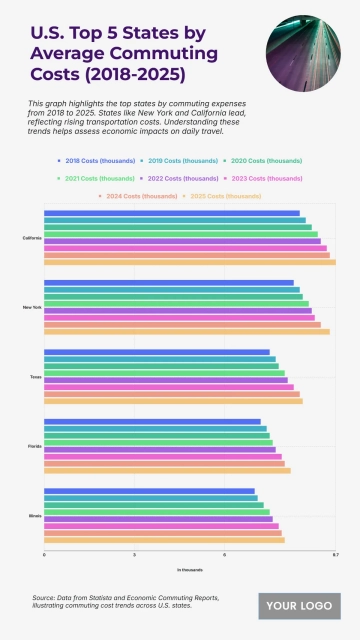
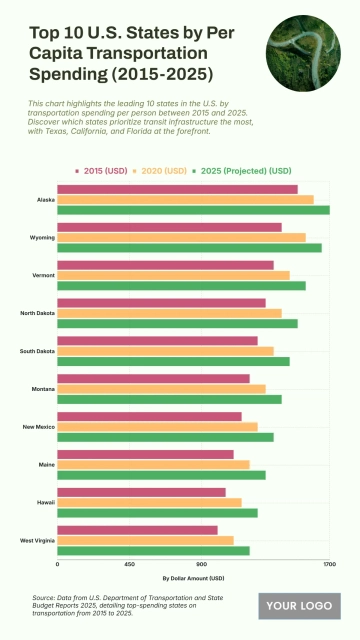
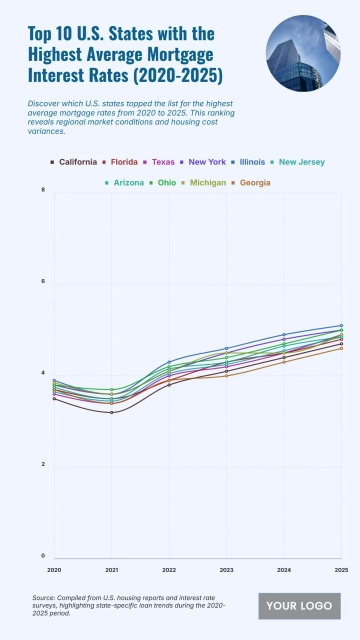
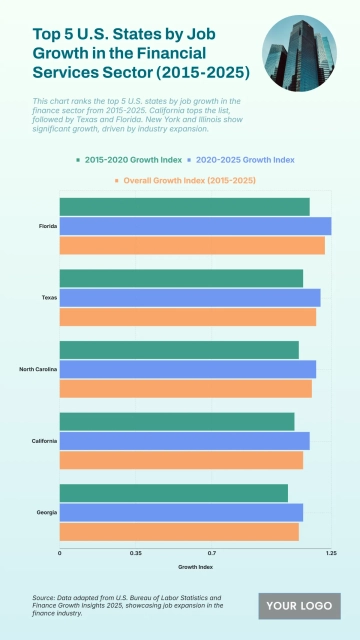
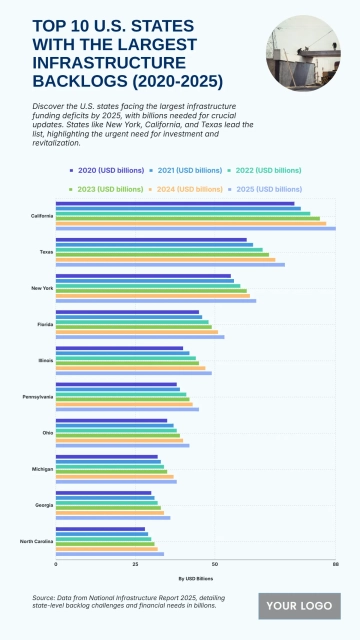
An informative 9:16 economy chart for comparing nonfarm job growth across leading U.S. states, professionally designed by Template.net, with a multi-line growth chart, a city skyline photo and a headline in emerald green, navy blue and soft aqua.
An informative 9:16 economy chart for comparing nonfarm job growth across leading U.S. states, professionally designed by Template.net, with a multi-line growth chart, a city skyline photo and a headline in emerald green, navy blue and soft aqua.