Free US Search Engine Ad Spend Growth from 2015 to 2025 Chart
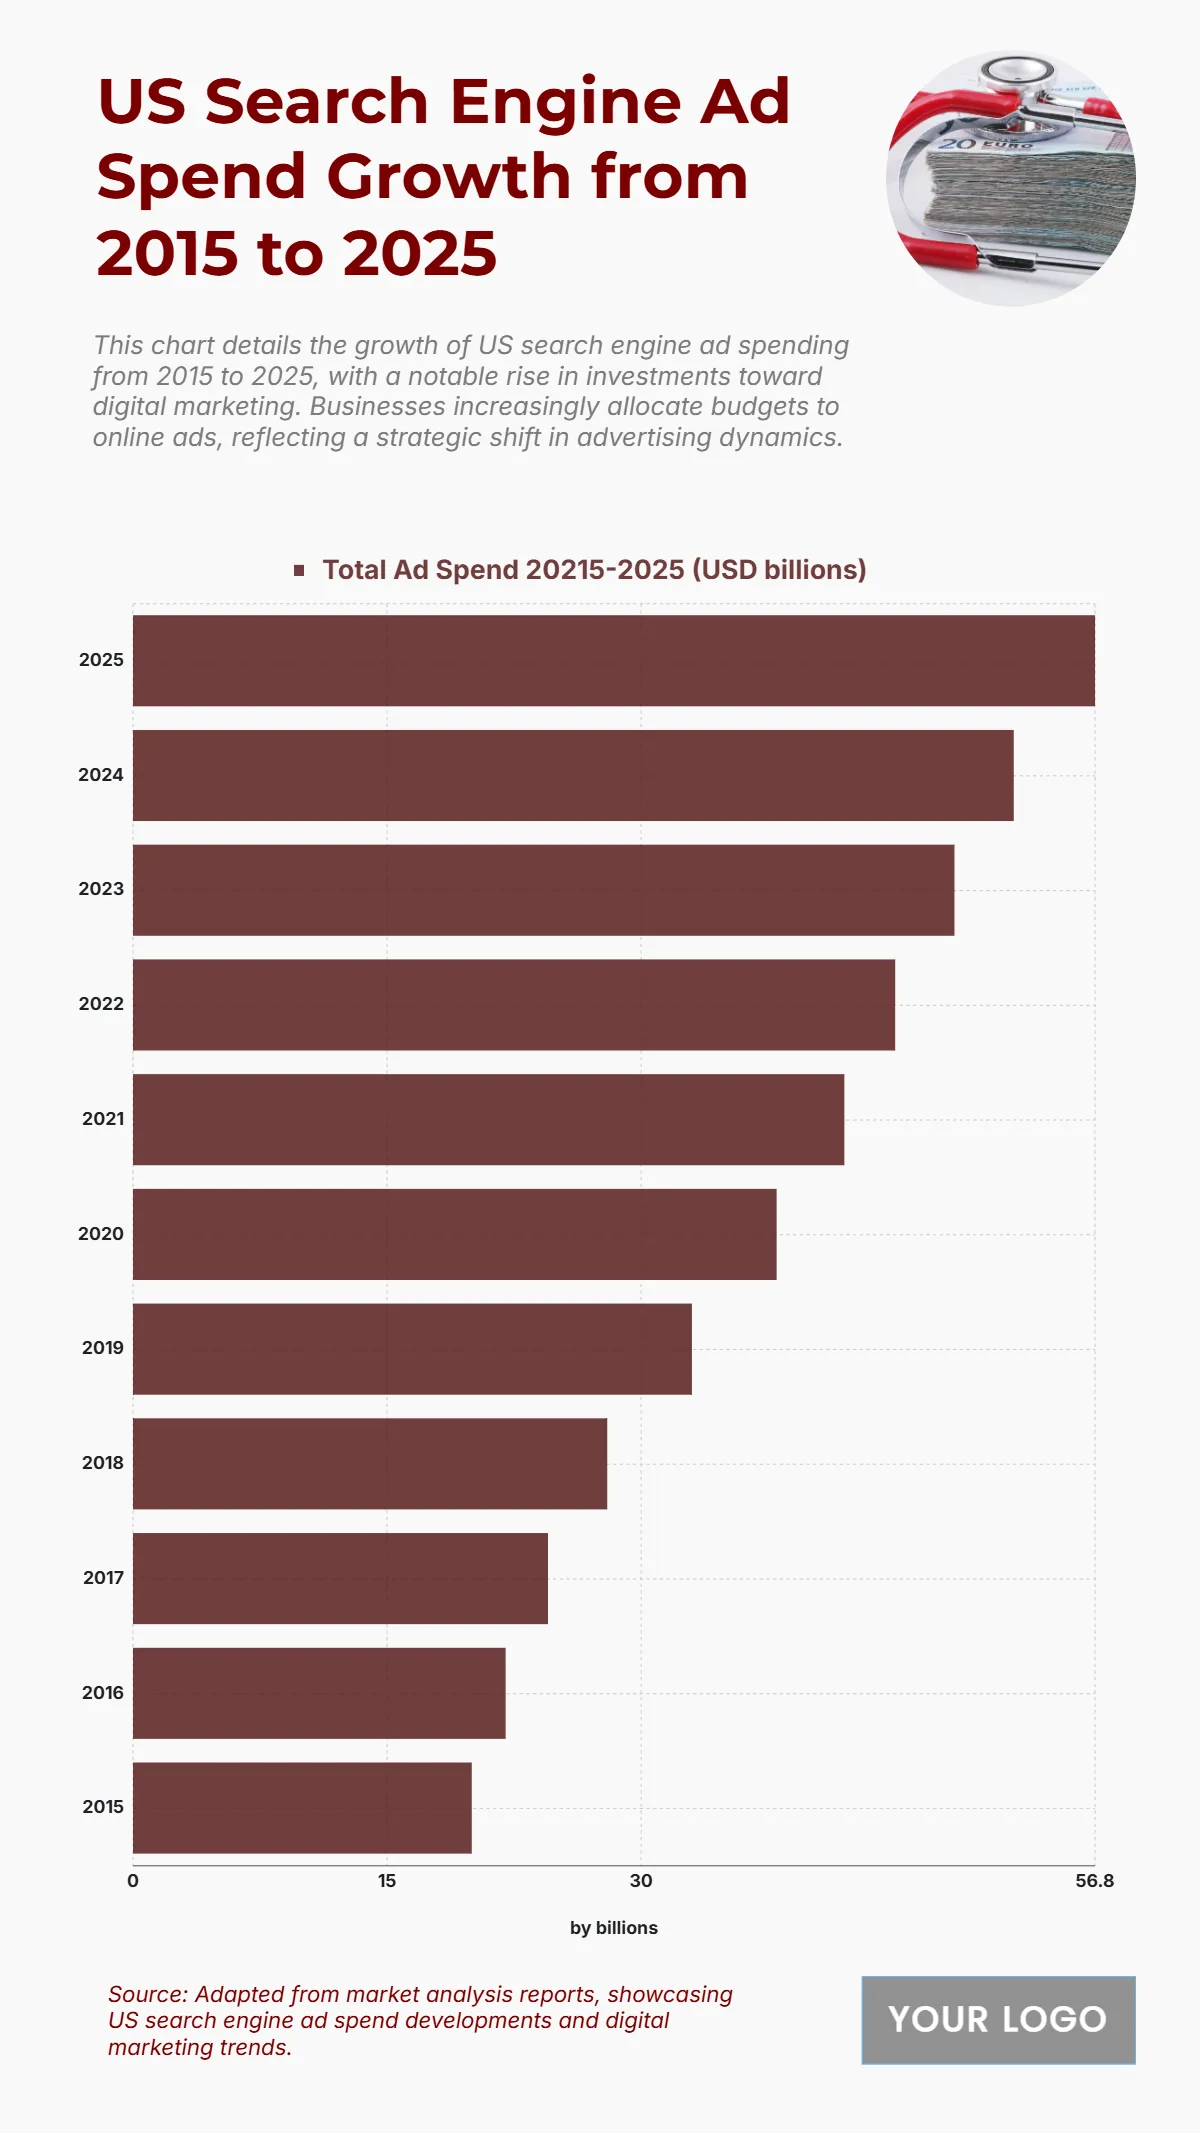
The chart shows a strong and steady increase in U.S. search engine ad spending over the decade from 2015 to 2025, reflecting a growing shift toward digital marketing. Ad spend starts at $20 billion in 2015, increasing to $22 billion in 2016 and $24.5 billion in 2017, showing early but consistent growth. By 2020, spending reaches $38 billion, demonstrating how online advertising has become a central strategy for businesses. The upward trend continues through $45 billion in 2022 and $52 billion in 2024, culminating at a peak of $56.8 billion in 2025. This sustained rise underlines the increasing importance of search engine platforms in driving visibility, brand awareness, and revenue. The sharp growth during the early 2020s signals accelerated investment as businesses adapt to digital-first strategies.
| Labels | Total Ad Spend 20215–2025 (USD billions) |
|---|---|
| 2025 | 56.8 |
| 2024 | 52.0 |
| 2023 | 48.5 |
| 2022 | 45.0 |
| 2021 | 42.0 |
| 2020 | 38.0 |
| 2019 | 33.0 |
| 2018 | 28.0 |
| 2017 | 24.5 |
| 2016 | 22.0 |
| 2015 | 20.0 |


