Free US E-commerce Ad Conversion Rates from 2015 to 2025 Chart
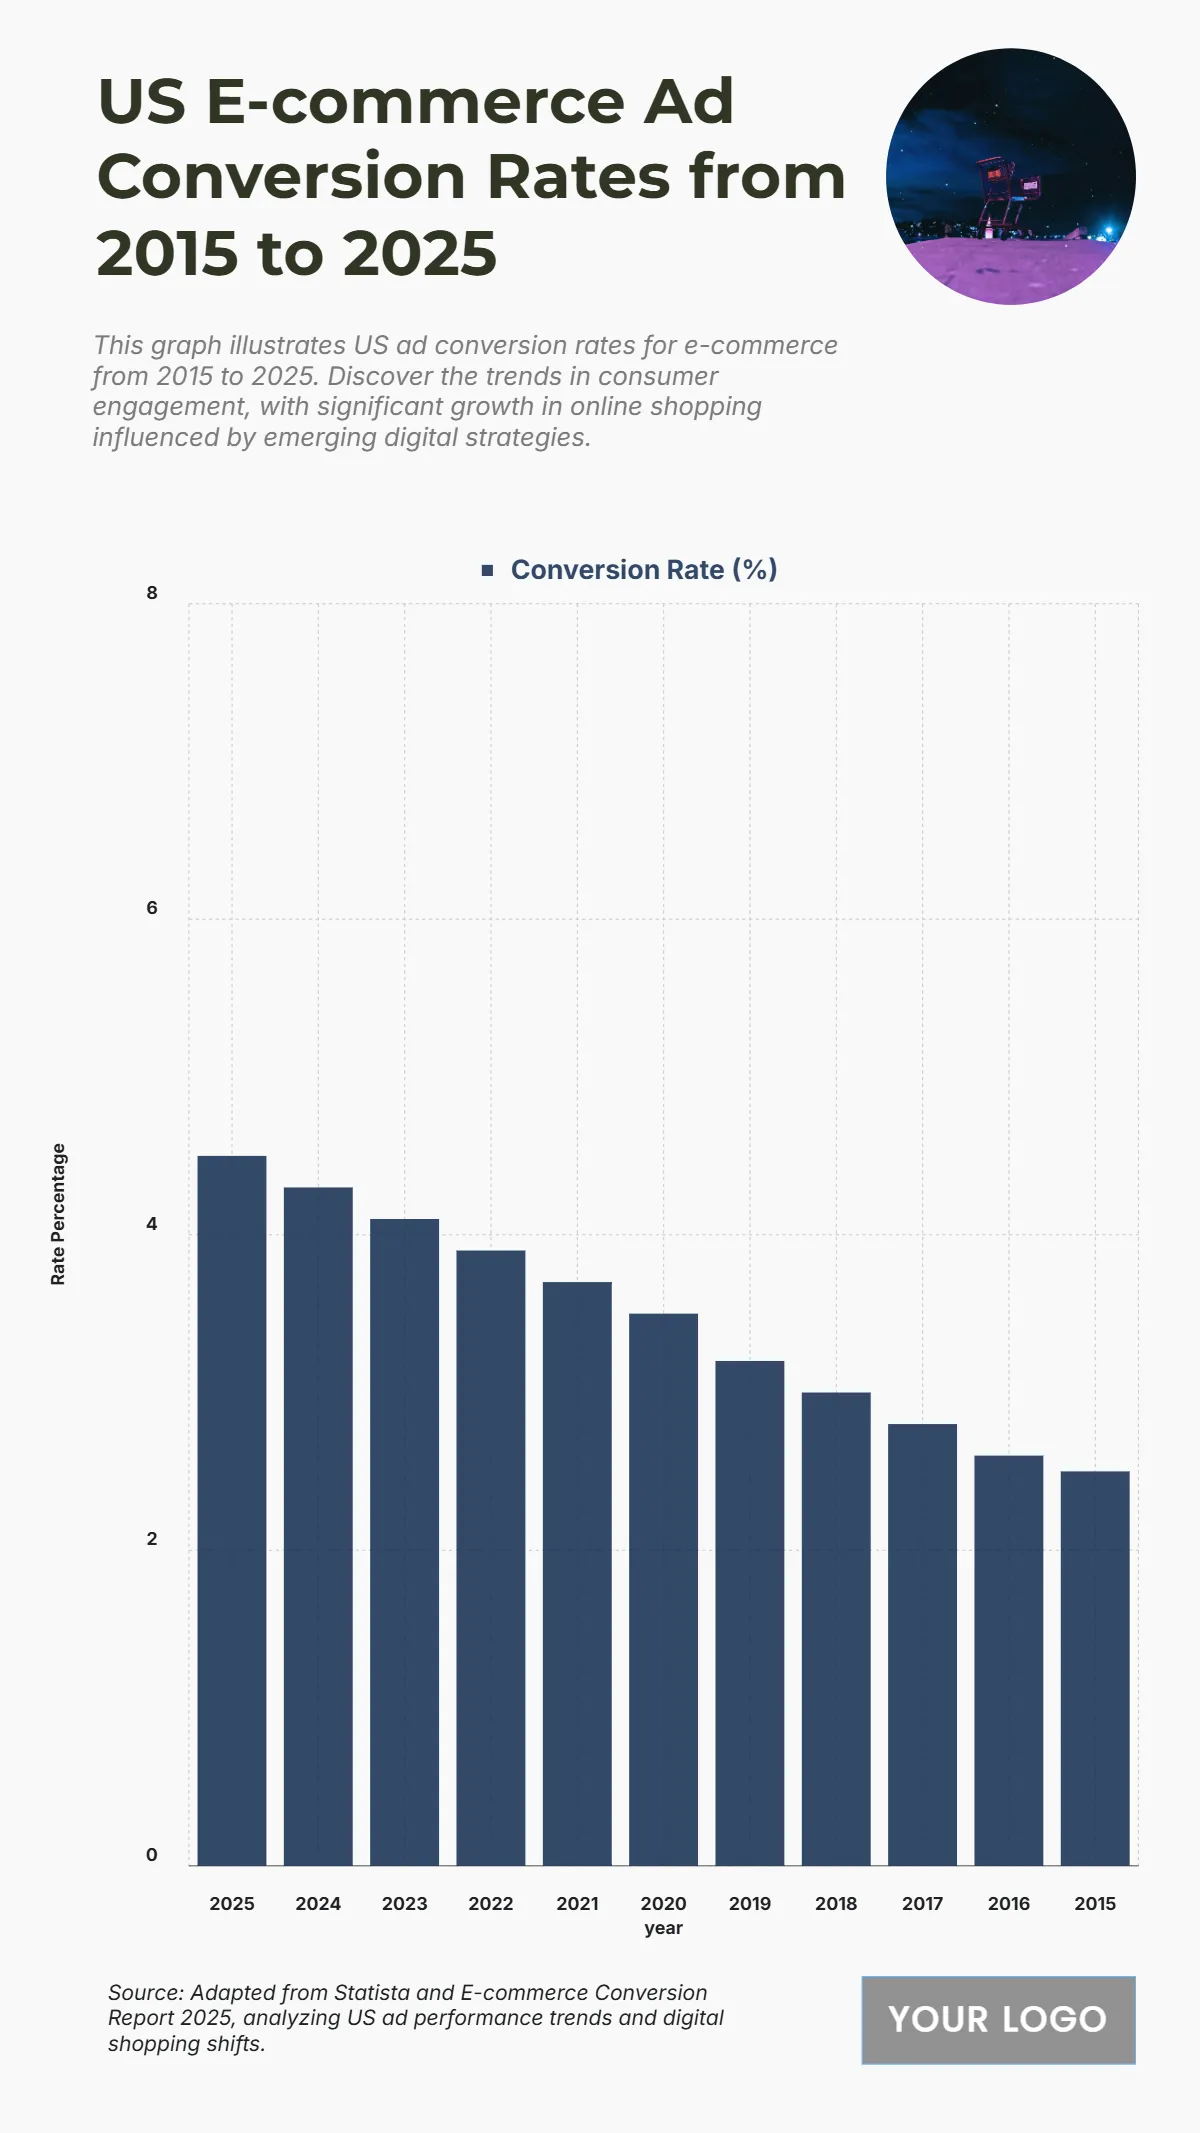
The chart illustrates a steady increase in U.S. e-commerce ad conversion rates over a ten-year span, reflecting improved ad targeting, personalization, and digital shopping experiences. Starting at 2.5% in 2015, the conversion rate grows gradually through 2.8% in 2017, reaching 3.5% in 2020. The growth accelerates in the early 2020s, hitting 3.9% in 2022, and 4.3% in 2024, before peaking at 4.5% in 2025. This upward trend signals increasing consumer trust and engagement with digital ads, aided by advanced analytics, better ad placements, and optimized checkout processes. The consistent rise, particularly from 2020 onward, also reflects how online retail strategies adapted to heightened e-commerce adoption. Overall, the data emphasizes a more effective digital ad ecosystem driving higher purchase conversion over time.
| Labels | Conversion Rate (%) |
|---|---|
| 2025 | 4.5 |
| 2024 | 4.3 |
| 2023 | 4.1 |
| 2022 | 3.9 |
| 2021 | 3.7 |
| 2020 | 3.5 |
| 2019 | 3.2 |
| 2018 | 3.0 |
| 2017 | 2.8 |
| 2016 | 2.6 |
| 2015 | 2.5 |


