Free U.S. Top 5 States by Telecommunications Revenue (2018-2025)
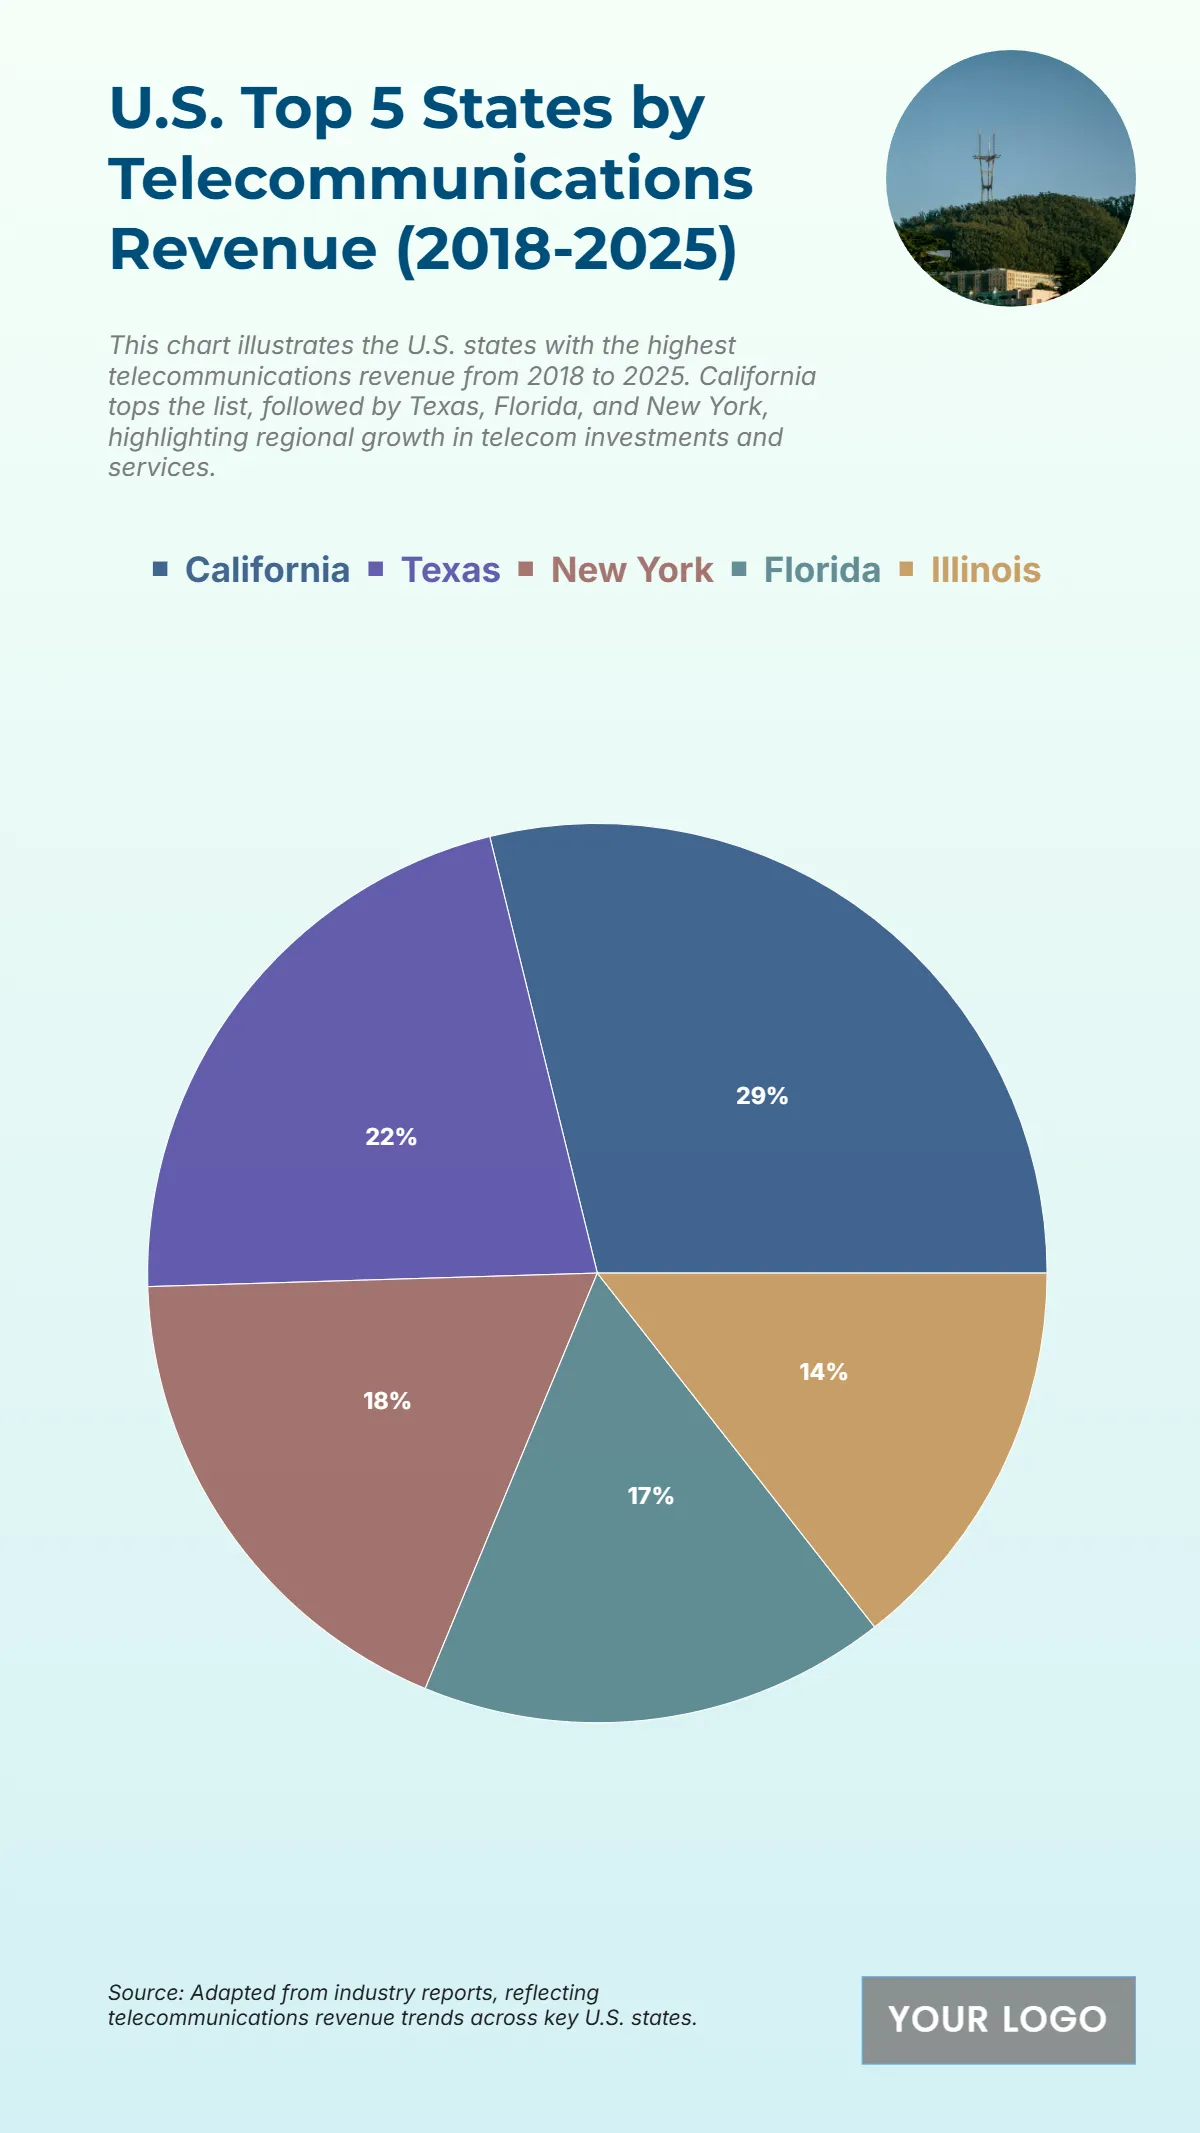
The chart shows the distribution of telecommunications revenue from 2018 to 2025, highlighting the top-performing states in the sector. California takes the largest share with $60 billion, representing 29% of the total, emphasizing its dominance in telecom investments and infrastructure. Texas follows with $45 billion and a 22% share, demonstrating its strong presence in the industry. New York secures $38 billion at 18%, while Florida contributes $35 billion accounting for 17%. Illinois rounds out the top five with $30 billion, equivalent to 14% of total telecommunications revenue. These figures reveal a concentration of telecom market power among a few states, with California leading by a significant margin. The combined performance of these five states illustrates key hubs driving telecommunications growth across the country, reflecting ongoing technological investment, infrastructure development, and increased service demand over the analysis period.
| Labels | Revenue (in billions) |
|---|---|
| California | 60 |
| Texas | 45 |
| New York | 38 |
| Florida | 35 |
| Illinois | 30 |


