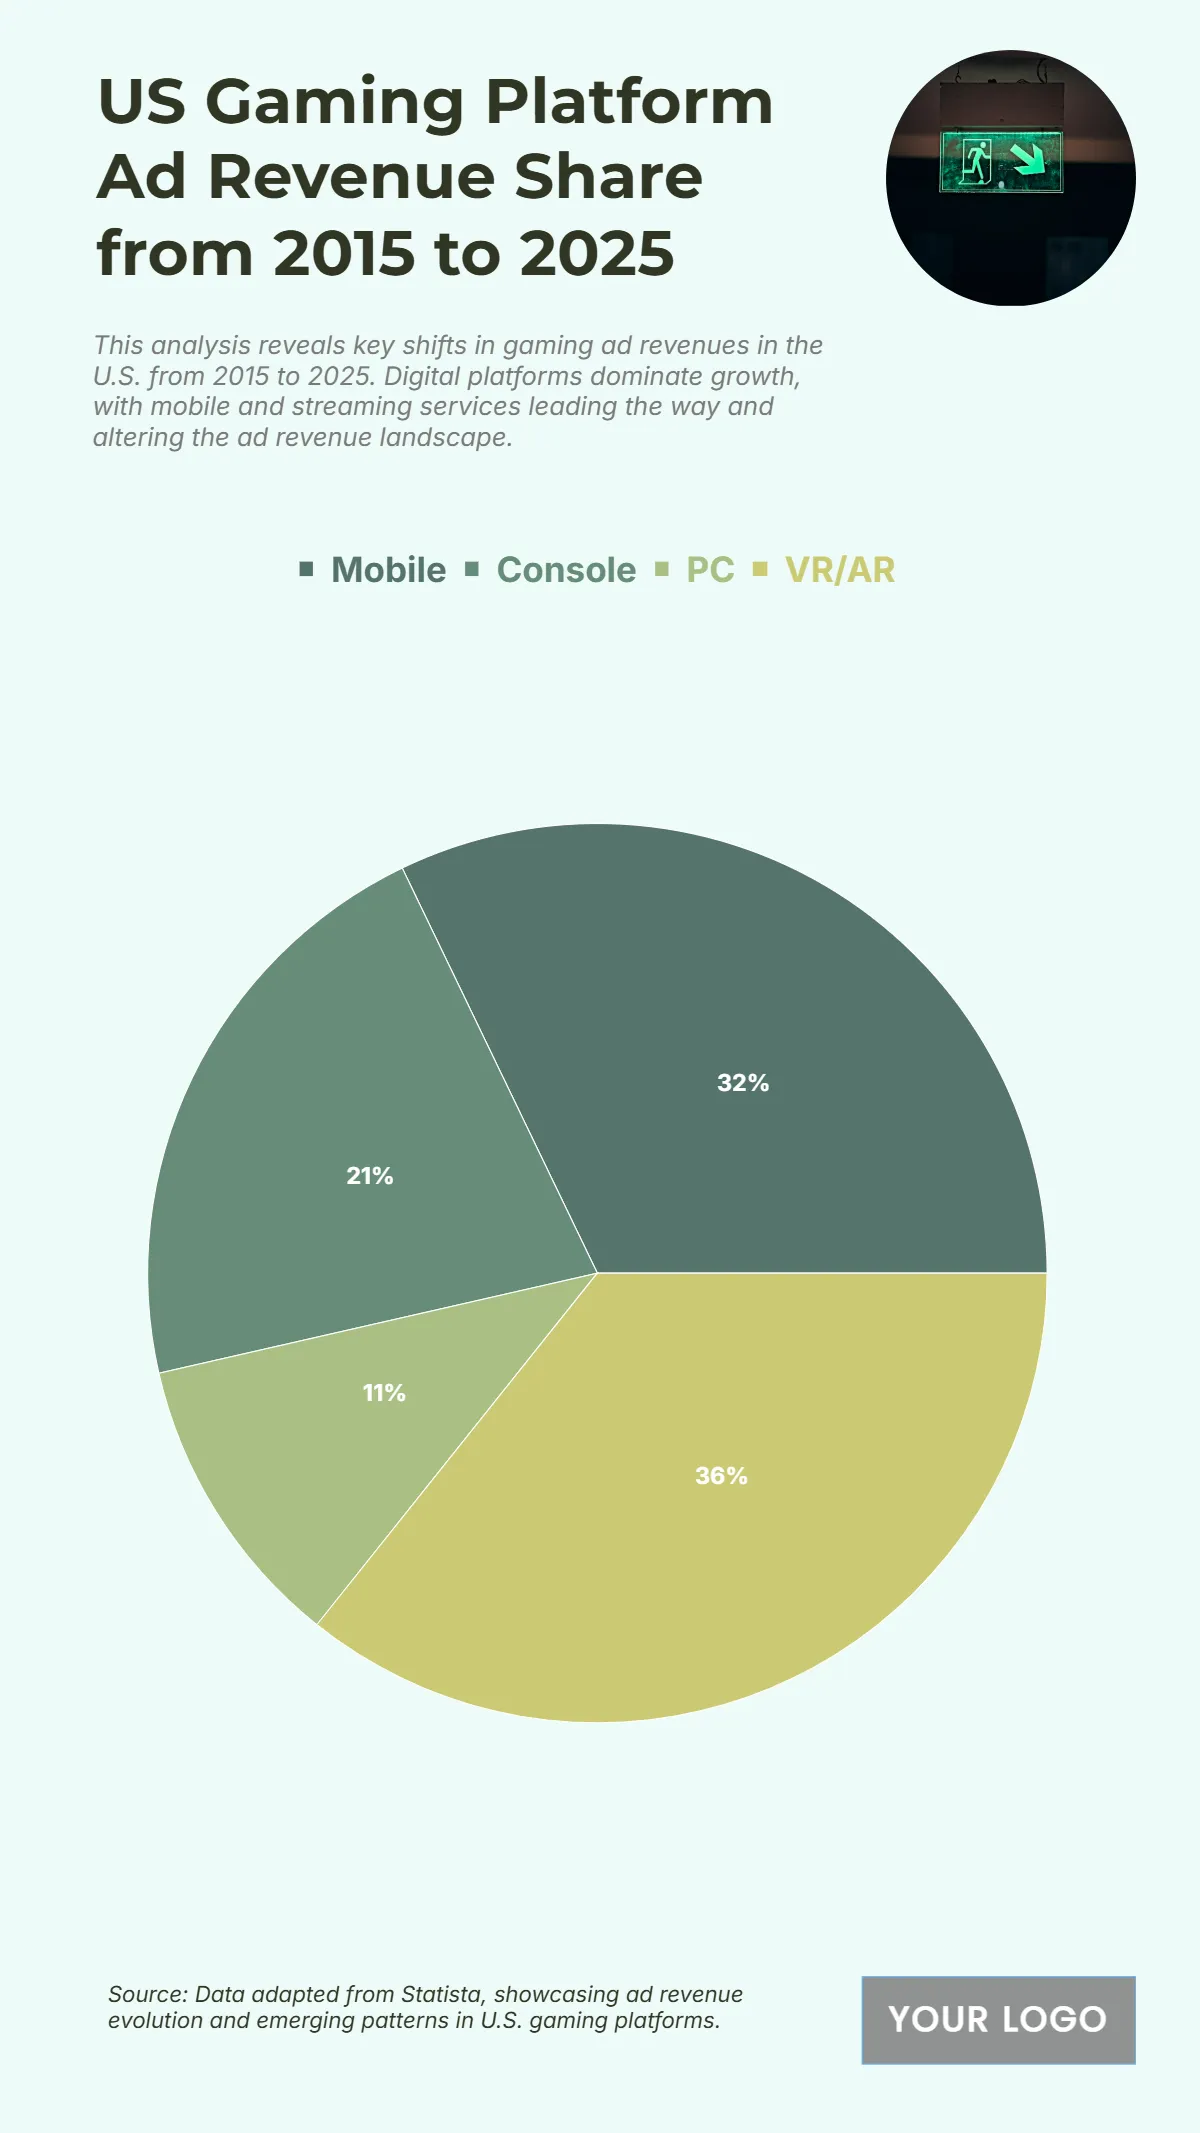
Free US Gaming Platform Ad Revenue Share from 2015 to 2025 Chart
The chart showcases the distribution of U.S. gaming platform ad revenue from 2015 to 2025, emphasizing the dominance of VR/AR and mobile platforms. VR/AR leads with $50 billion, capturing 36% of the total revenue, a clear indicator of the rising popularity and monetization potential of immersive technologies. Mobile advertising follows closely at $45 billion or 32%, reflecting the strength of mobile gaming as a mainstream ad channel. Console platforms secure $30 billion (21%), maintaining a solid but smaller share, while PC platforms account for the smallest portion at $15 billion (11%), showing a more stable but less dominant role. Overall, the data highlights how emerging VR/AR technologies and mobile devices are reshaping the gaming ad revenue landscape, shifting focus away from traditional PC and console models.
| Labels | 2015–2025 Average Revenue Share (billions) |
|---|---|
| Mobile | 45 |
| Console | 30 |
| PC | 15 |
| VR/AR | 50 |


