Free US Consumer Electronics Advertising Trends from 2015 to 2025
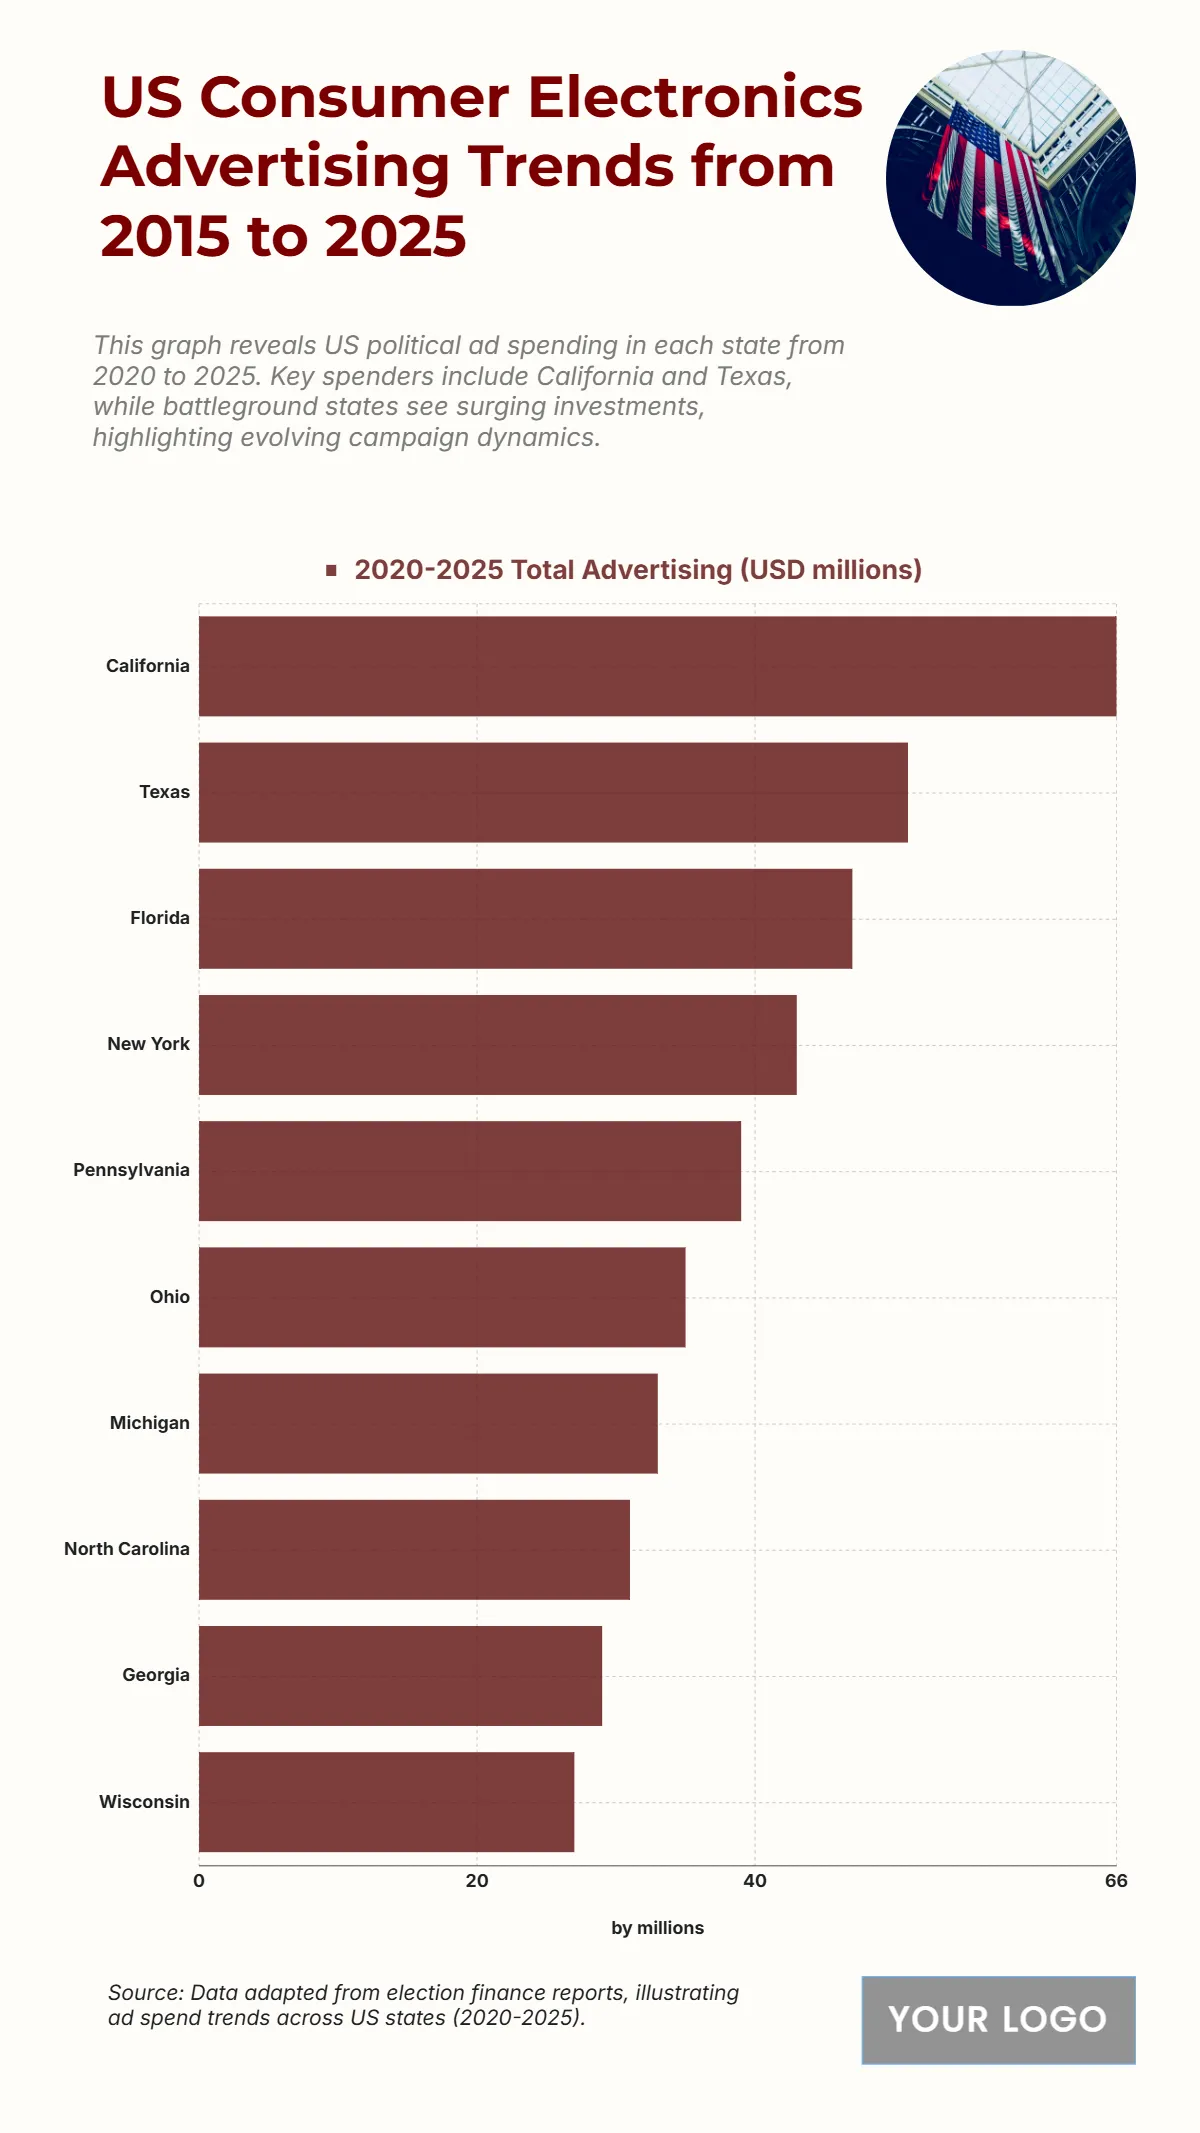
The chart shows political campaign ad spending from 2020 to 2025 across U.S. states, with California emerging as the top spender at $66 million, reflecting its major role in national elections. Texas follows at $51 million, demonstrating its status as a high-stakes battleground with growing political influence. Florida ranks third with $47 million, also a key swing state that consistently attracts significant campaign investments. New York comes next at $43 million, while Pennsylvania stands at $39 million, showing strong competitiveness during electoral cycles. Ohio and Michigan record spending of $35 million and $33 million respectively, followed by North Carolina at $31 million and Georgia at $29 million. Wisconsin, another strategic swing state, rounds out the top 10 with $27 million. This pattern highlights where major parties and campaigns are concentrating resources to influence voters in politically decisive states.
| Labels | 2020–2025 Total Spending (USD millions) |
|---|---|
| California | 66 |
| Texas | 51 |
| Florida | 47 |
| New York | 43 |
| Pennsylvania | 39 |
| Ohio | 35 |
| Michigan | 33 |
| North Carolina | 31 |
| Georgia | 29 |
| Wisconsin | 27 |


