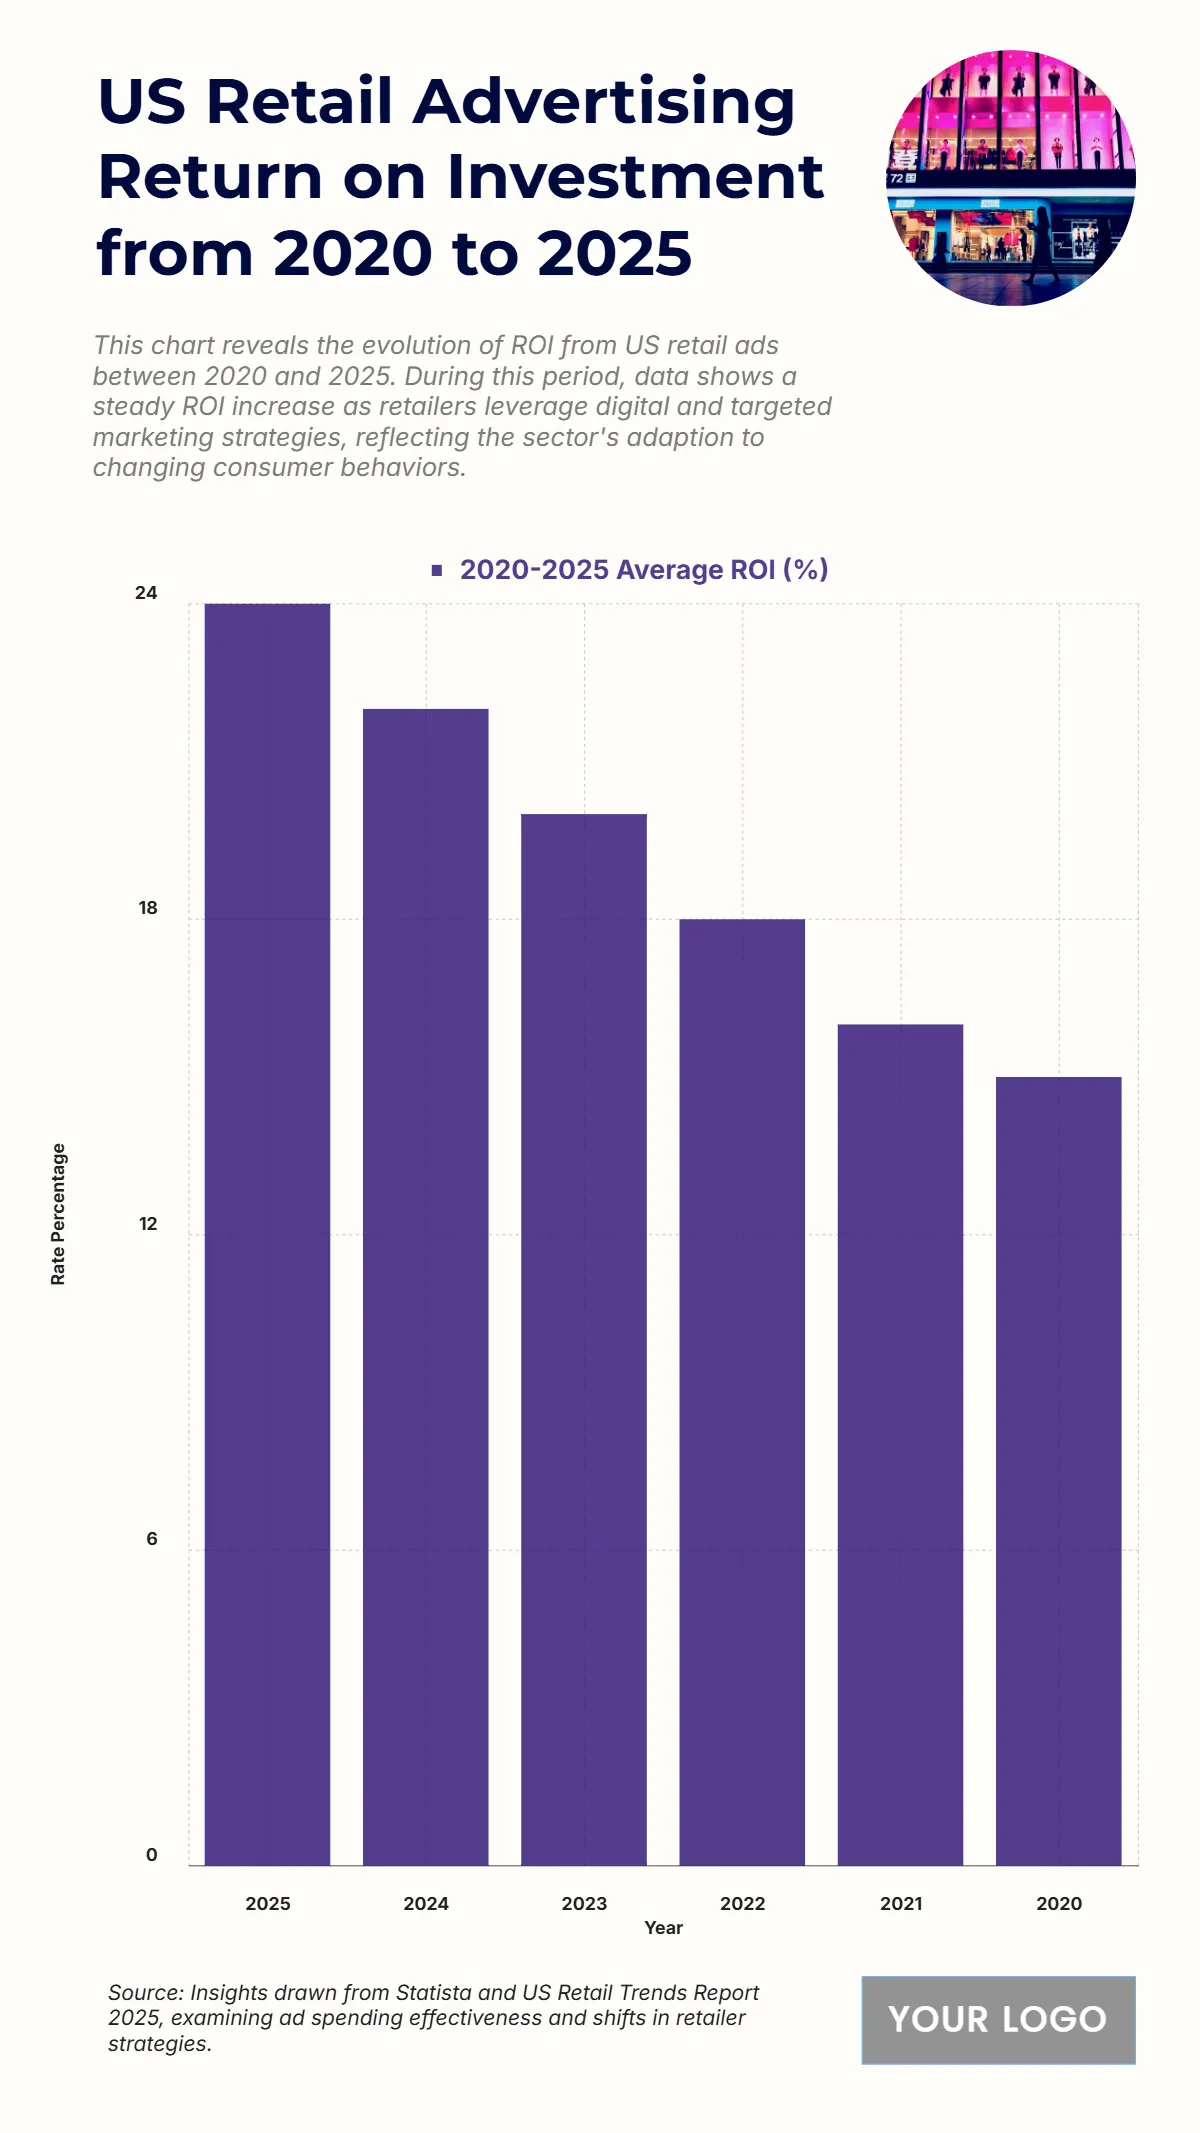
Free US Retail Advertising Return on Investment from 2020 to 2025 Chart
The chart shows a steady rise in U.S. retail advertising ROI from 2020 to 2025, reflecting stronger digital strategies and targeted marketing adoption. ROI increased from 15% in 2020 to 24% in 2025, highlighting improved ad performance and efficiency over time. Notably, ROI grew to 16% in 2021, then climbed to 18% in 2022, and reached 20% in 2023, showcasing consistent year-over-year gains. By 2024, ROI further rose to 22%, indicating stronger campaign optimization and conversion strategies. This trend underscores how retailers are increasingly leveraging digital ad channels to maximize returns, enhance audience targeting, and drive higher engagement, setting the sector on a path of sustained growth.
| Labels | 2020–2025 Average ROI (%) |
|---|---|
| 2025 | 24 |
| 2024 | 22 |
| 2023 | 20 |
| 2022 | 18 |
| 2021 | 16 |
| 2020 | 15 |


