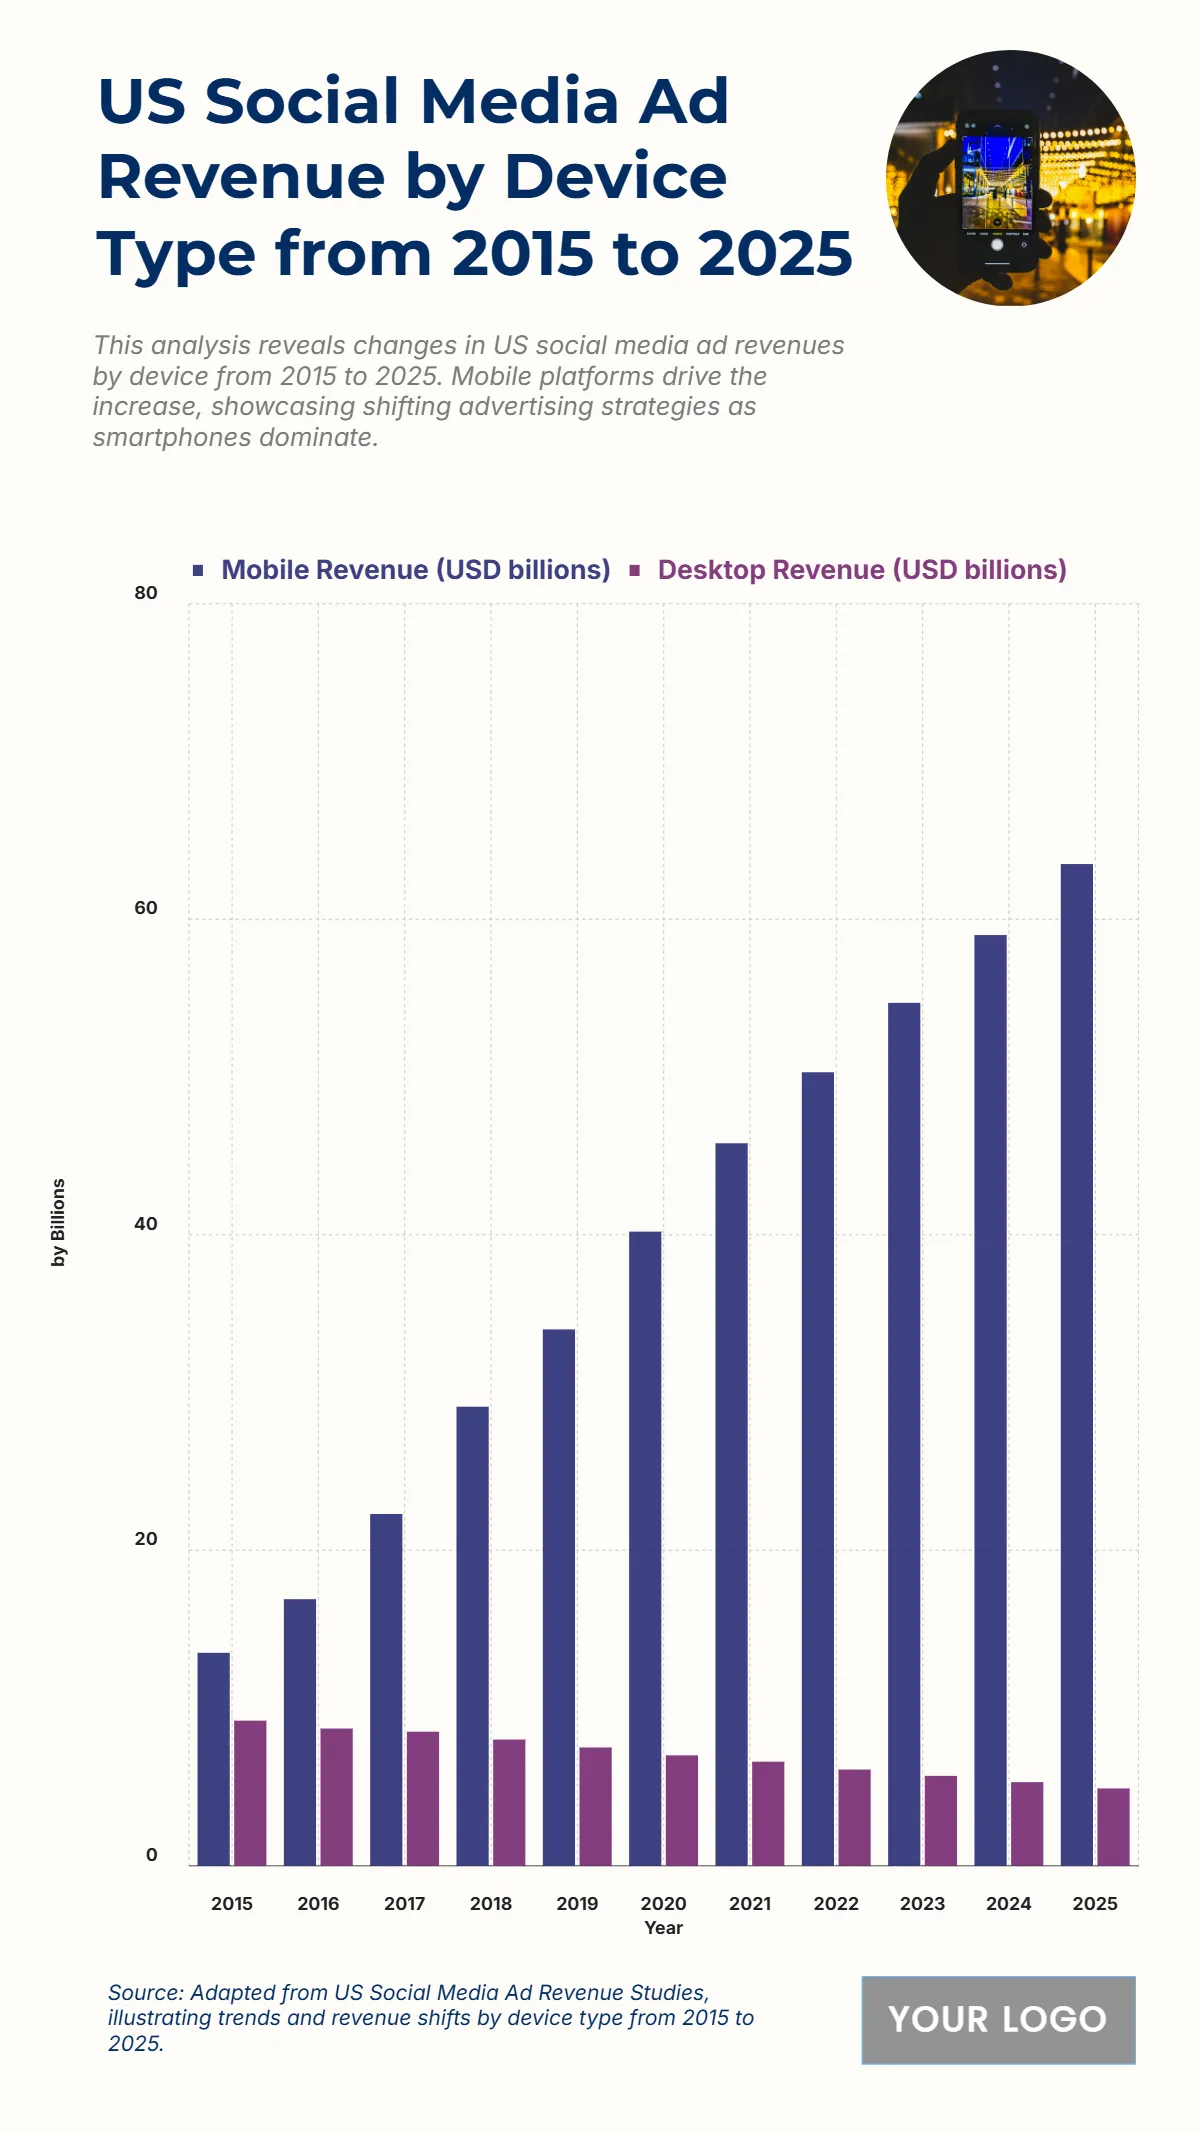
Free US Social Media Ad Revenue by Device Type from 2015 to 2025 Chart
The chart illustrates a clear shift in U.S. social media ad revenue trends from desktop to mobile between 2015 and 2025. Mobile ad revenue starts at $13.5 billion in 2015 and shows a steady rise each year, reaching $29.1 billion in 2018, surpassing desktop early on. The growth accelerates sharply, hitting $40.2 billion in 2020, $50.3 billion in 2022, and peaks at $63.5 billion in 2025. In contrast, desktop ad revenue experiences a gradual decline from $9.2 billion in 2015 to $4.9 billion in 2025, indicating a shift in advertising strategies aligned with increased mobile usage. This contrast highlights how advertisers have adapted to consumer behavior, prioritizing mobile-first campaigns to maximize engagement. The continuous rise in mobile revenue alongside desktop’s decline underscores a dominant digital trend shaped by smartphone adoption and mobile-centric social platforms.
| Labels | Mobile Revenue (USD billions) | Desktop Revenue (USD billions) |
|---|---|---|
| 2015 | 13.5 | 9.2 |
| 2016 | 16.9 | 8.7 |
| 2017 | 22.3 | 8.5 |
| 2018 | 29.1 | 8.0 |
| 2019 | 34.0 | 7.5 |
| 2020 | 40.2 | 7.0 |
| 2021 | 45.8 | 6.6 |
| 2022 | 50.3 | 6.1 |
| 2023 | 54.7 | 5.7 |
| 2024 | 59.0 | 5.3 |
| 2025 | 63.5 | 4.9 |


