Free US Video Ad Spend Share by Platform from 2020 to 2025 Chart
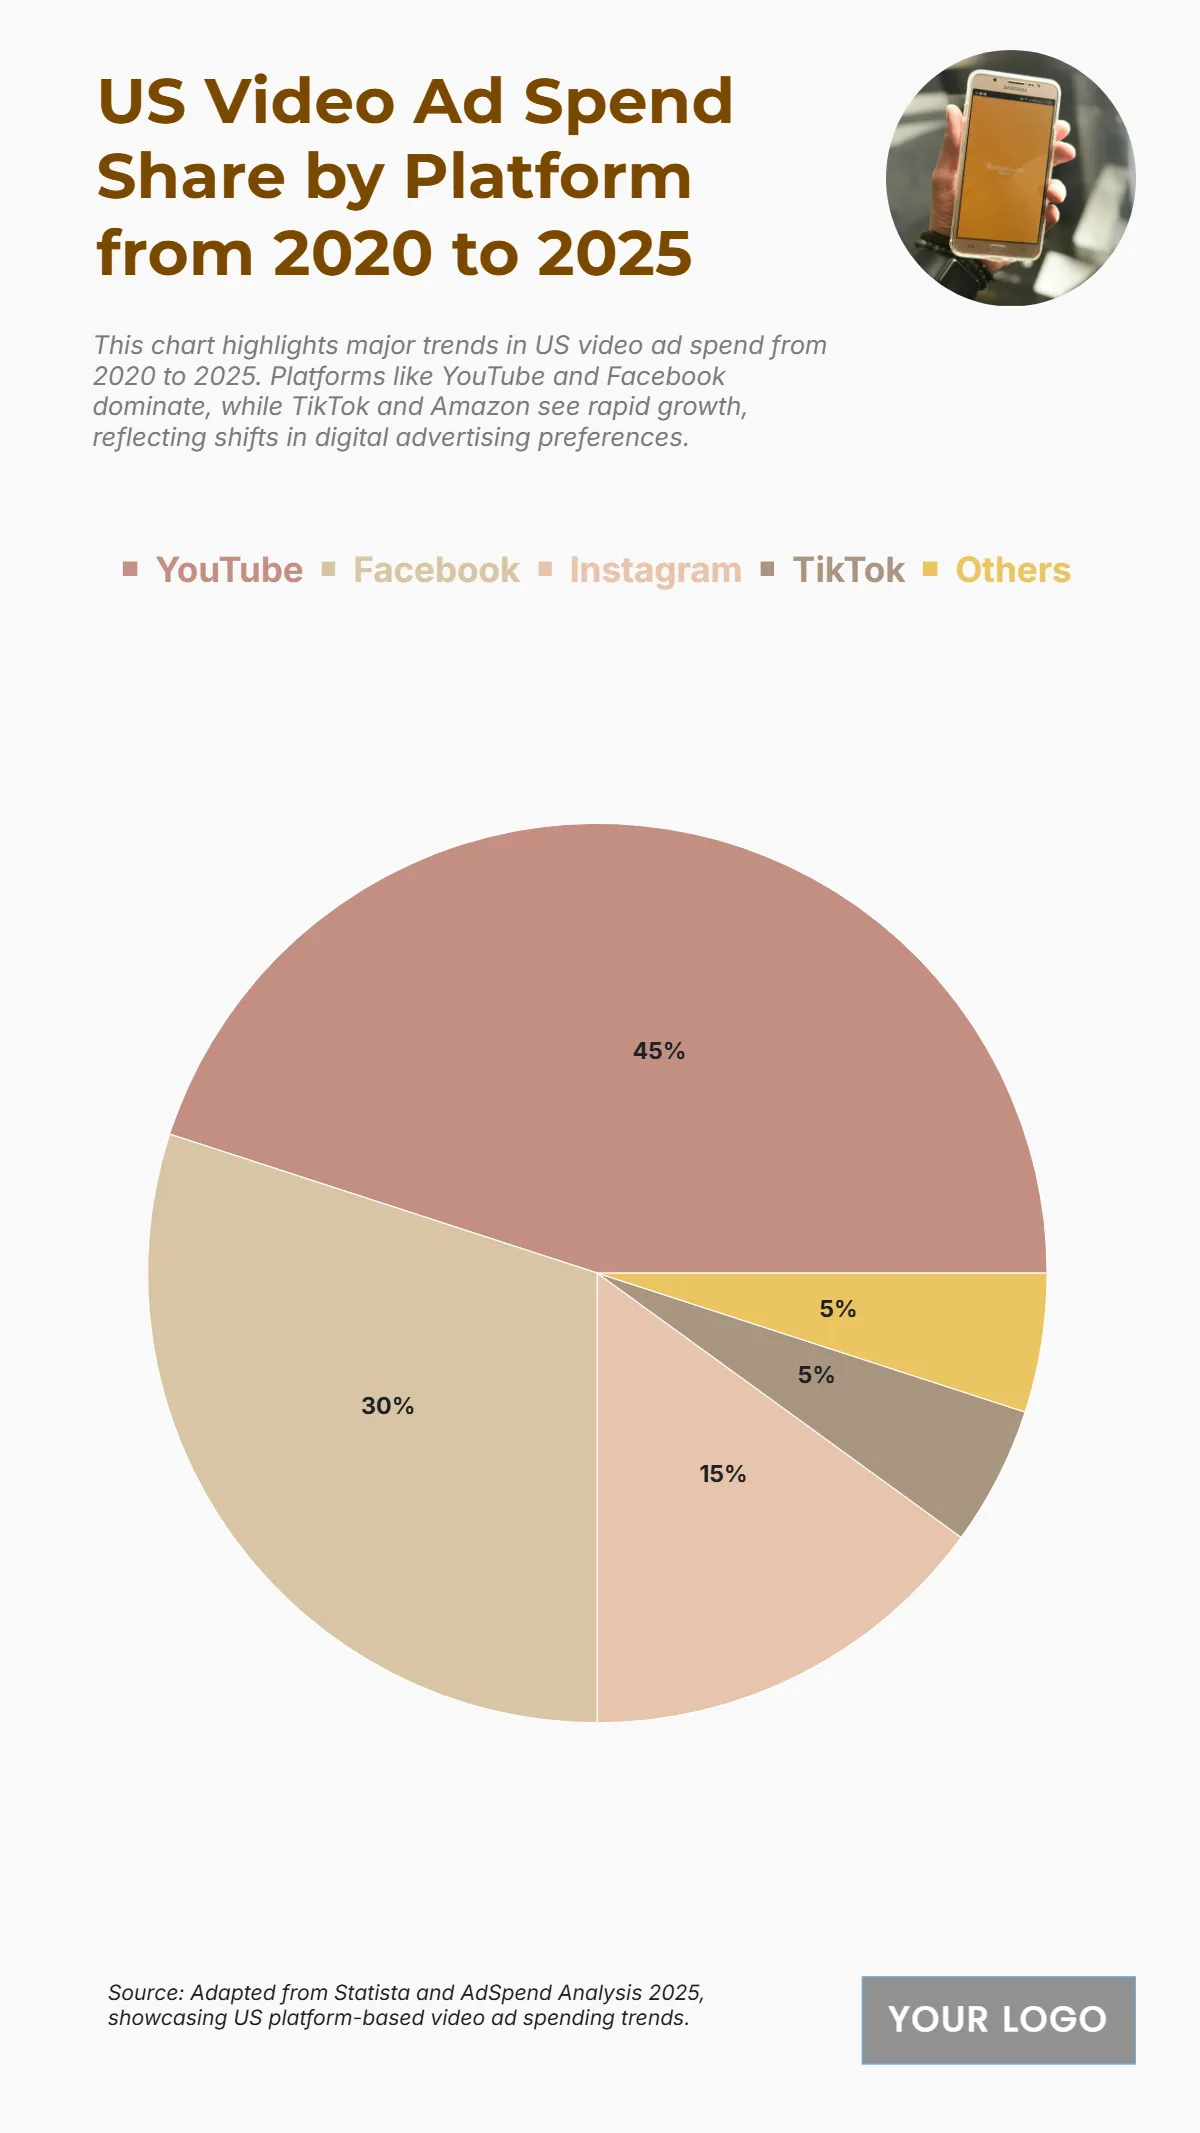
The chart shows that YouTube dominates U.S. video ad spend from 2020 to 2025, securing $45 billion, which accounts for 45% of the total market. Facebook follows with $30 billion or 30%, maintaining a strong presence as a leading advertising platform. Instagram captures $15 billion (15%), showing steady engagement among advertisers targeting visual-first audiences. Meanwhile, TikTok and Others each hold $5 billion (5%), indicating growing but still smaller shares compared to the top two platforms. This distribution highlights how YouTube and Facebook together command three-quarters of the market, underscoring their continued dominance in video advertising, while newer platforms like TikTok gradually expand their footprint.
| Labels | Total Ad Spend Share 2020–2025 (billions) |
|---|---|
| YouTube | 45 |
| 30 | |
| 15 | |
| TikTok | 5 |
| Others | 5 |


