Free US Advertising Performance Metrics by Channel from 2015 to 2025 Chart
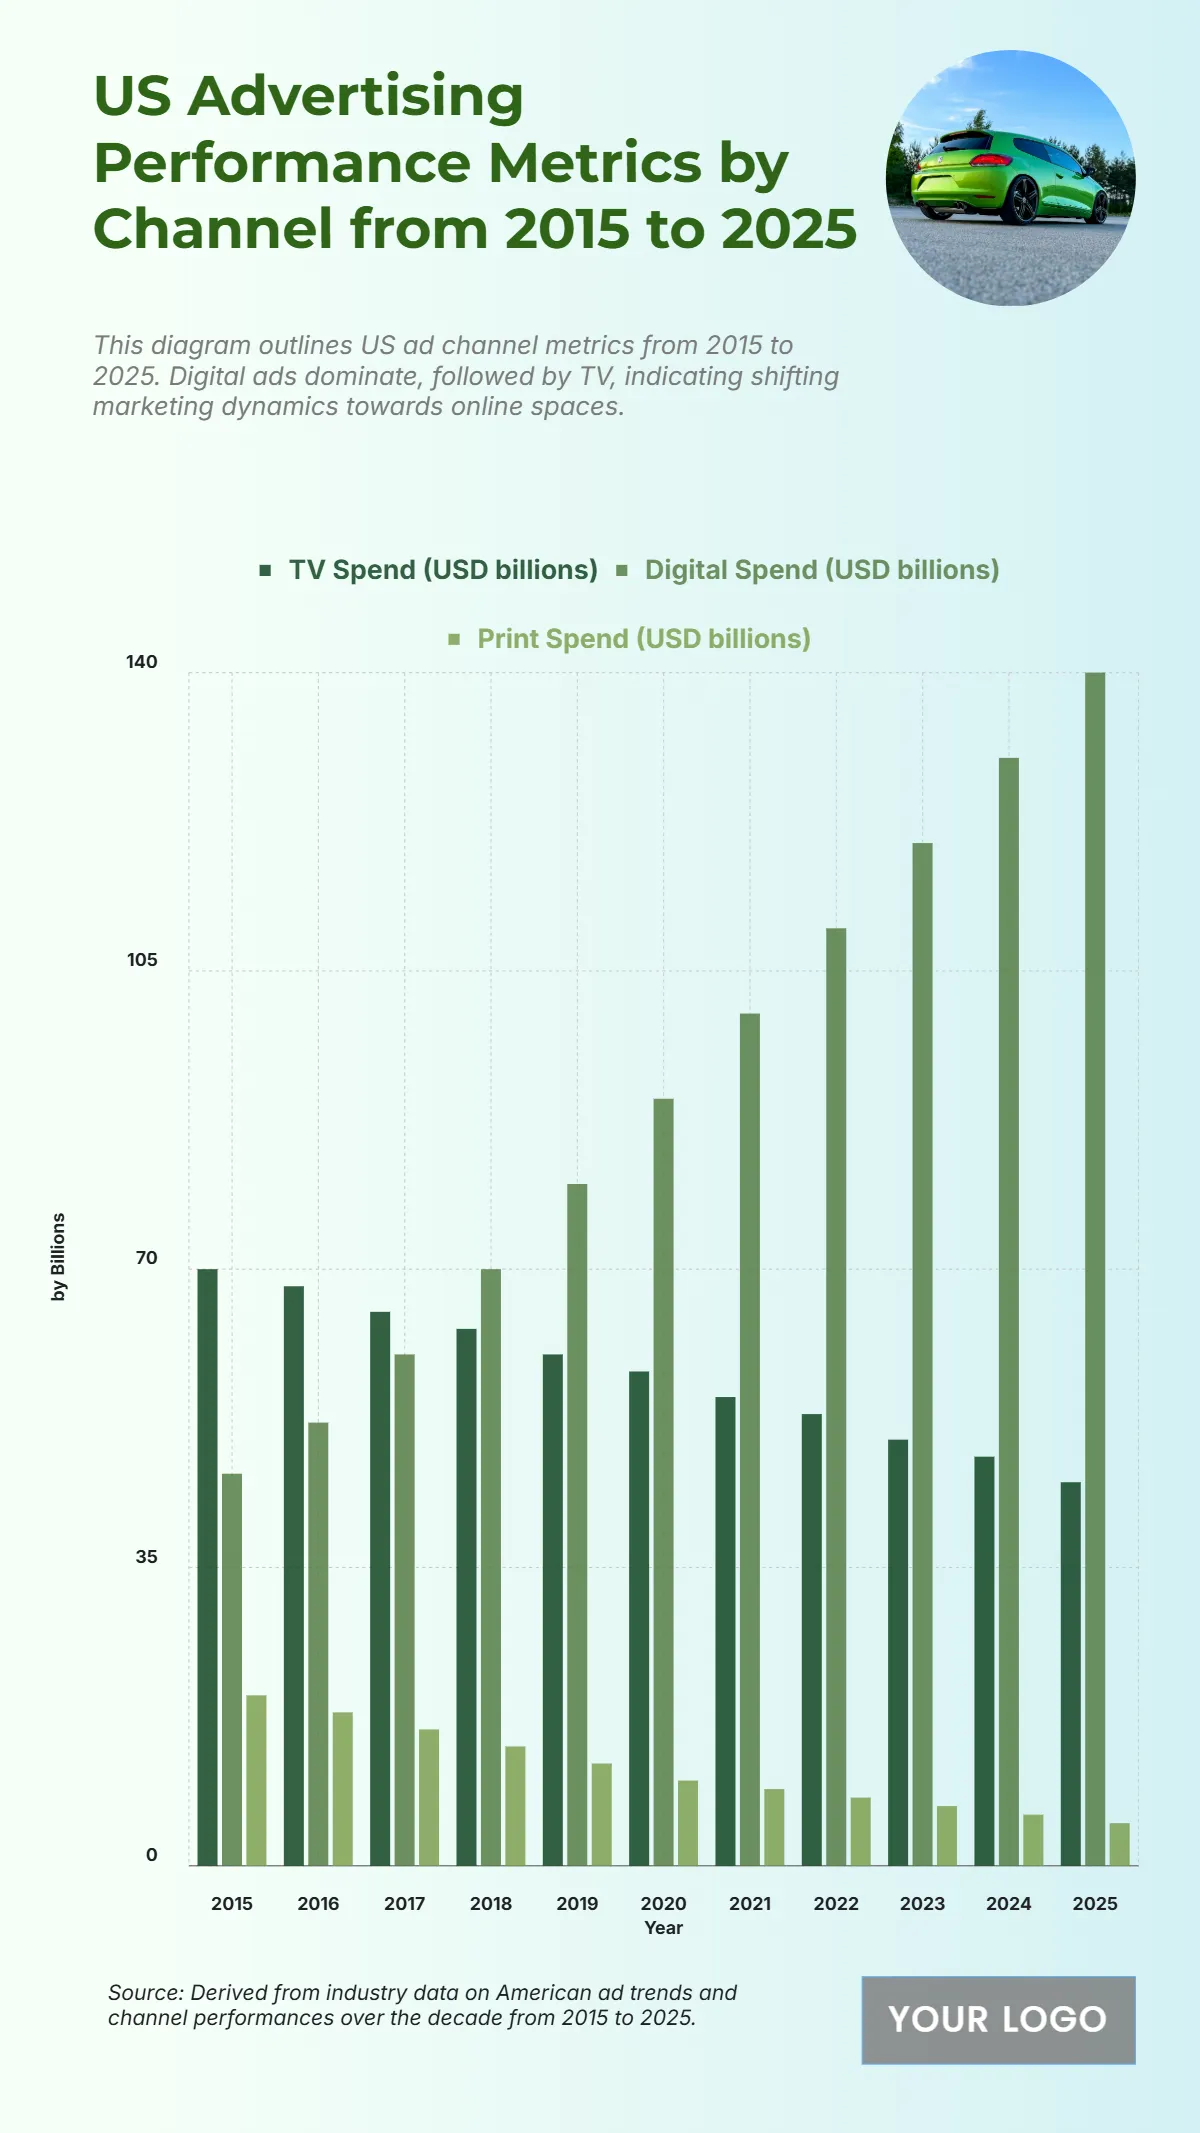
The chart illustrates a major shift in U.S. advertising spend by channel from 2015 to 2025, highlighting the rapid rise of digital advertising. Digital spend surged from $46 billion in 2015 to $140 billion in 2025, surpassing all other channels and demonstrating advertisers’ growing preference for online platforms. In contrast, TV spend steadily declined from $70 billion in 2015 to $45 billion in 2025, reflecting a gradual shift away from traditional media. Meanwhile, print advertising experienced the sharpest drop, falling from $20 billion in 2015 to only $5 billion in 2025, showing a clear downturn in reliance on print. This decade-long trend signals a digital-first advertising landscape, where investments increasingly target online engagement and programmatic strategies.
| Labels | TV Spend (USD billions) | Digital Spend (USD billions) | Print Spend (USD billions) |
|---|---|---|---|
| 2015 | 70 | 46 | 20 |
| 2016 | 68 | 52 | 18 |
| 2017 | 65 | 60 | 16 |
| 2018 | 63 | 70 | 14 |
| 2019 | 60 | 80 | 12 |
| 2020 | 58 | 90 | 10 |
| 2021 | 55 | 100 | 9 |
| 2022 | 53 | 110 | 8 |
| 2023 | 50 | 120 | 7 |
| 2024 | 48 | 130 | 6 |
| 2025 | 45 | 140 | 5 |


