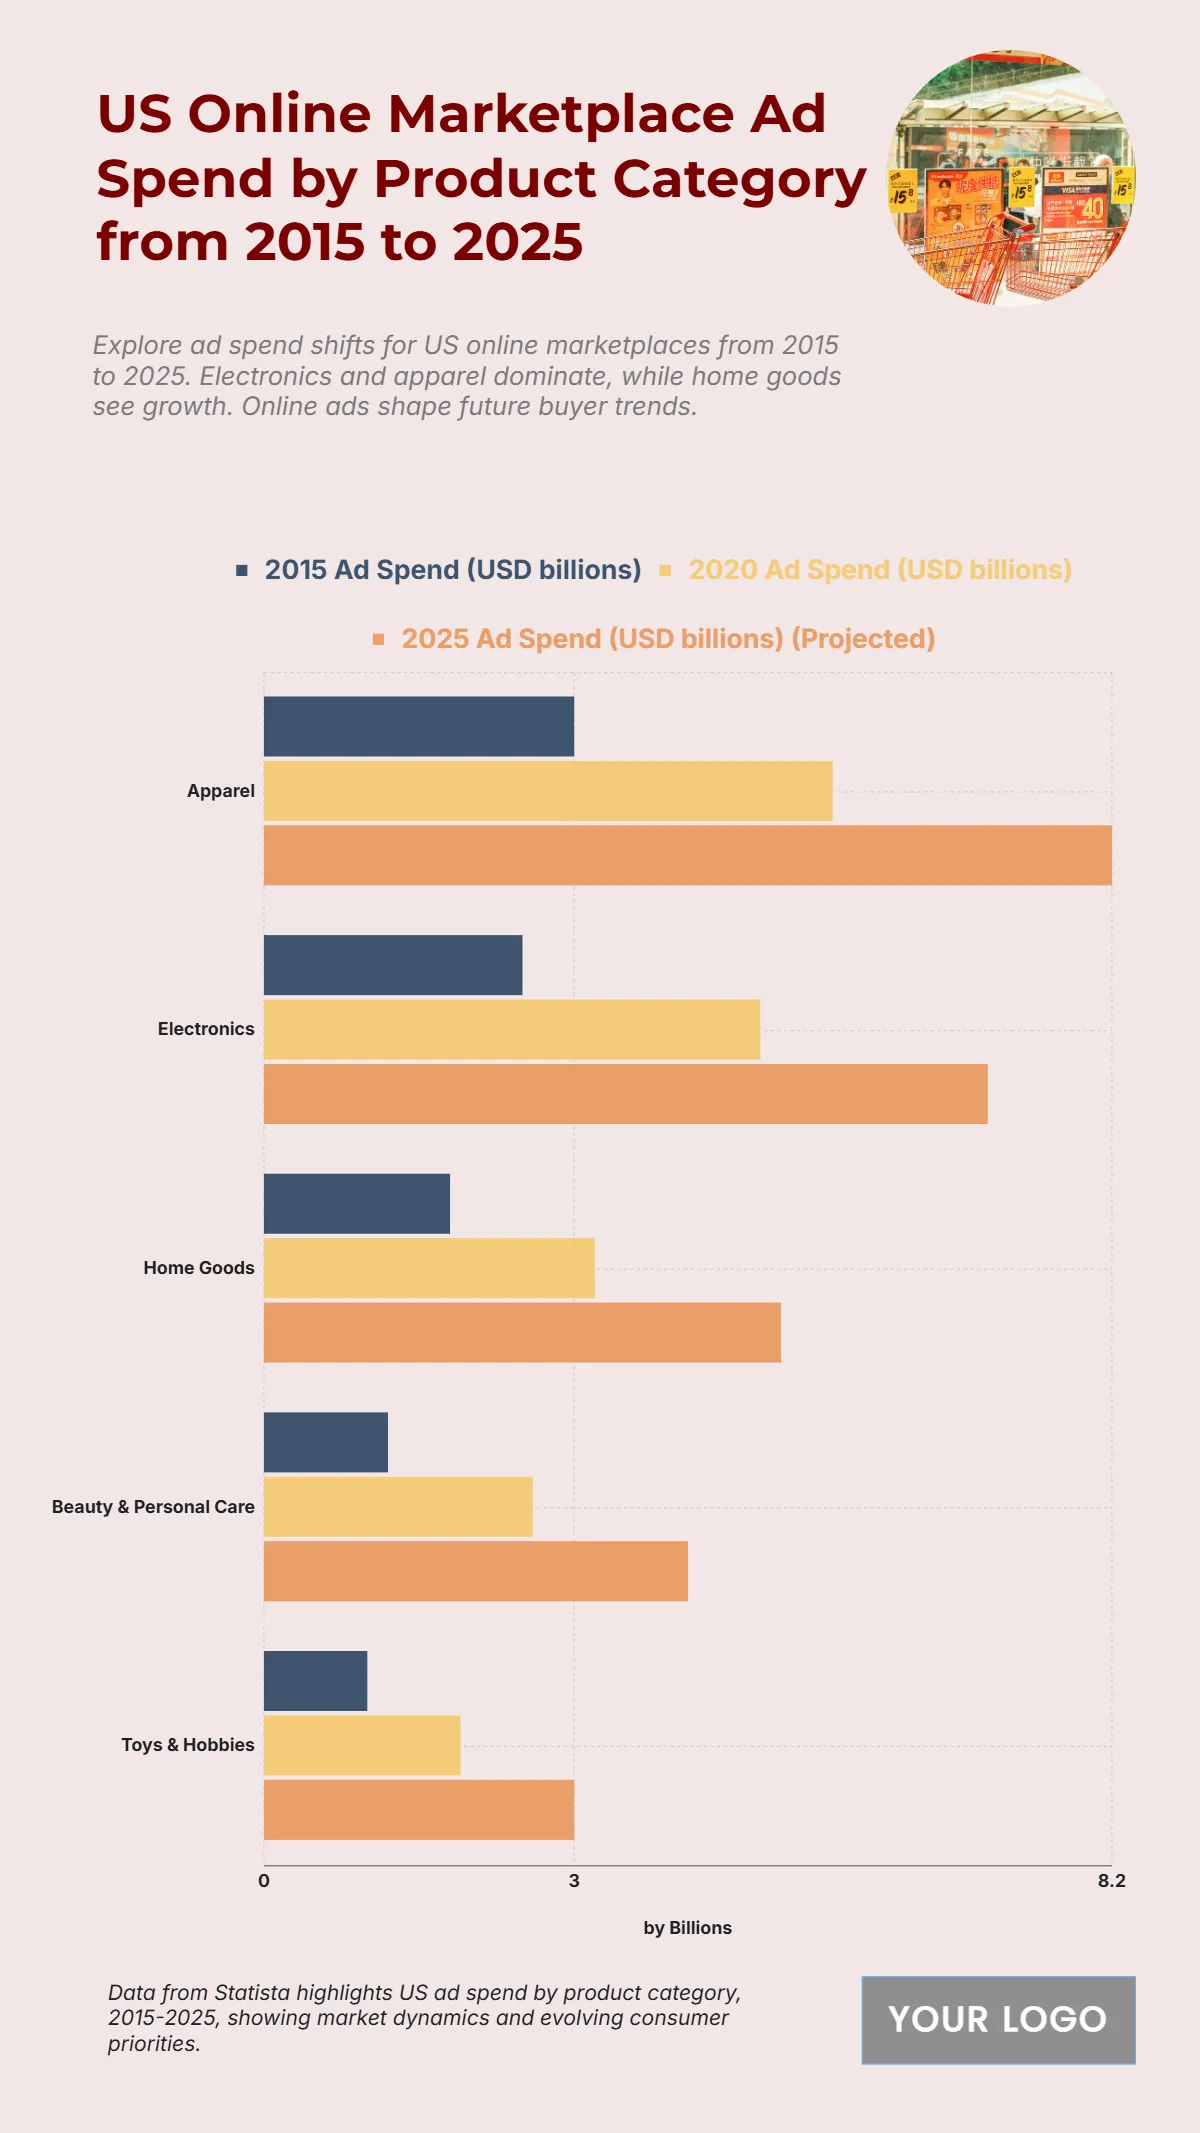
Free US Online Marketplace Ad Spend by Product Category from 2015 to 2025 Chart
The chart highlights a significant increase in U.S. online marketplace ad spending across key product categories from 2015 to 2025, driven by the rapid growth of e-commerce. Apparel dominates the market, growing from $3 billion in 2015 to $5.5 billion in 2020 and is projected to hit $8.2 billion by 2025. Electronics follows with an increase from $2.5 billion in 2015 to $4.8 billion in 2020, reaching $7 billion by 2025, reflecting strong demand in consumer tech. Home Goods rises steadily from $1.8 billion in 2015 to $3.2 billion in 2020 and $5 billion in 2025, while Beauty & Personal Care grows from $1.2 billion to $2.6 billion and $4.1 billion in the same period. Toys & Hobbies show moderate but consistent growth, doubling from $1 billion in 2015 to $1.9 billion in 2020 and projected to reach $3 billion by 2025. This trend underlines expanding digital ad investments across industries.
| Labels | 2015 Ad Spend (USD billions) | 2020 Ad Spend (USD billions) | 2025 Ad Spend (USD billions) (Projected) |
|---|---|---|---|
| Apparel | 3.0 | 5.5 | 8.2 |
| Electronics | 2.5 | 4.8 | 7.0 |
| Home Goods | 1.8 | 3.2 | 5.0 |
| Beauty & Personal Care | 1.2 | 2.6 | 4.1 |
| Toys & Hobbies | 1.0 | 1.9 | 3.0 |


