Free US Search Ad Spend by Sector from 2015 to 2025 Chart
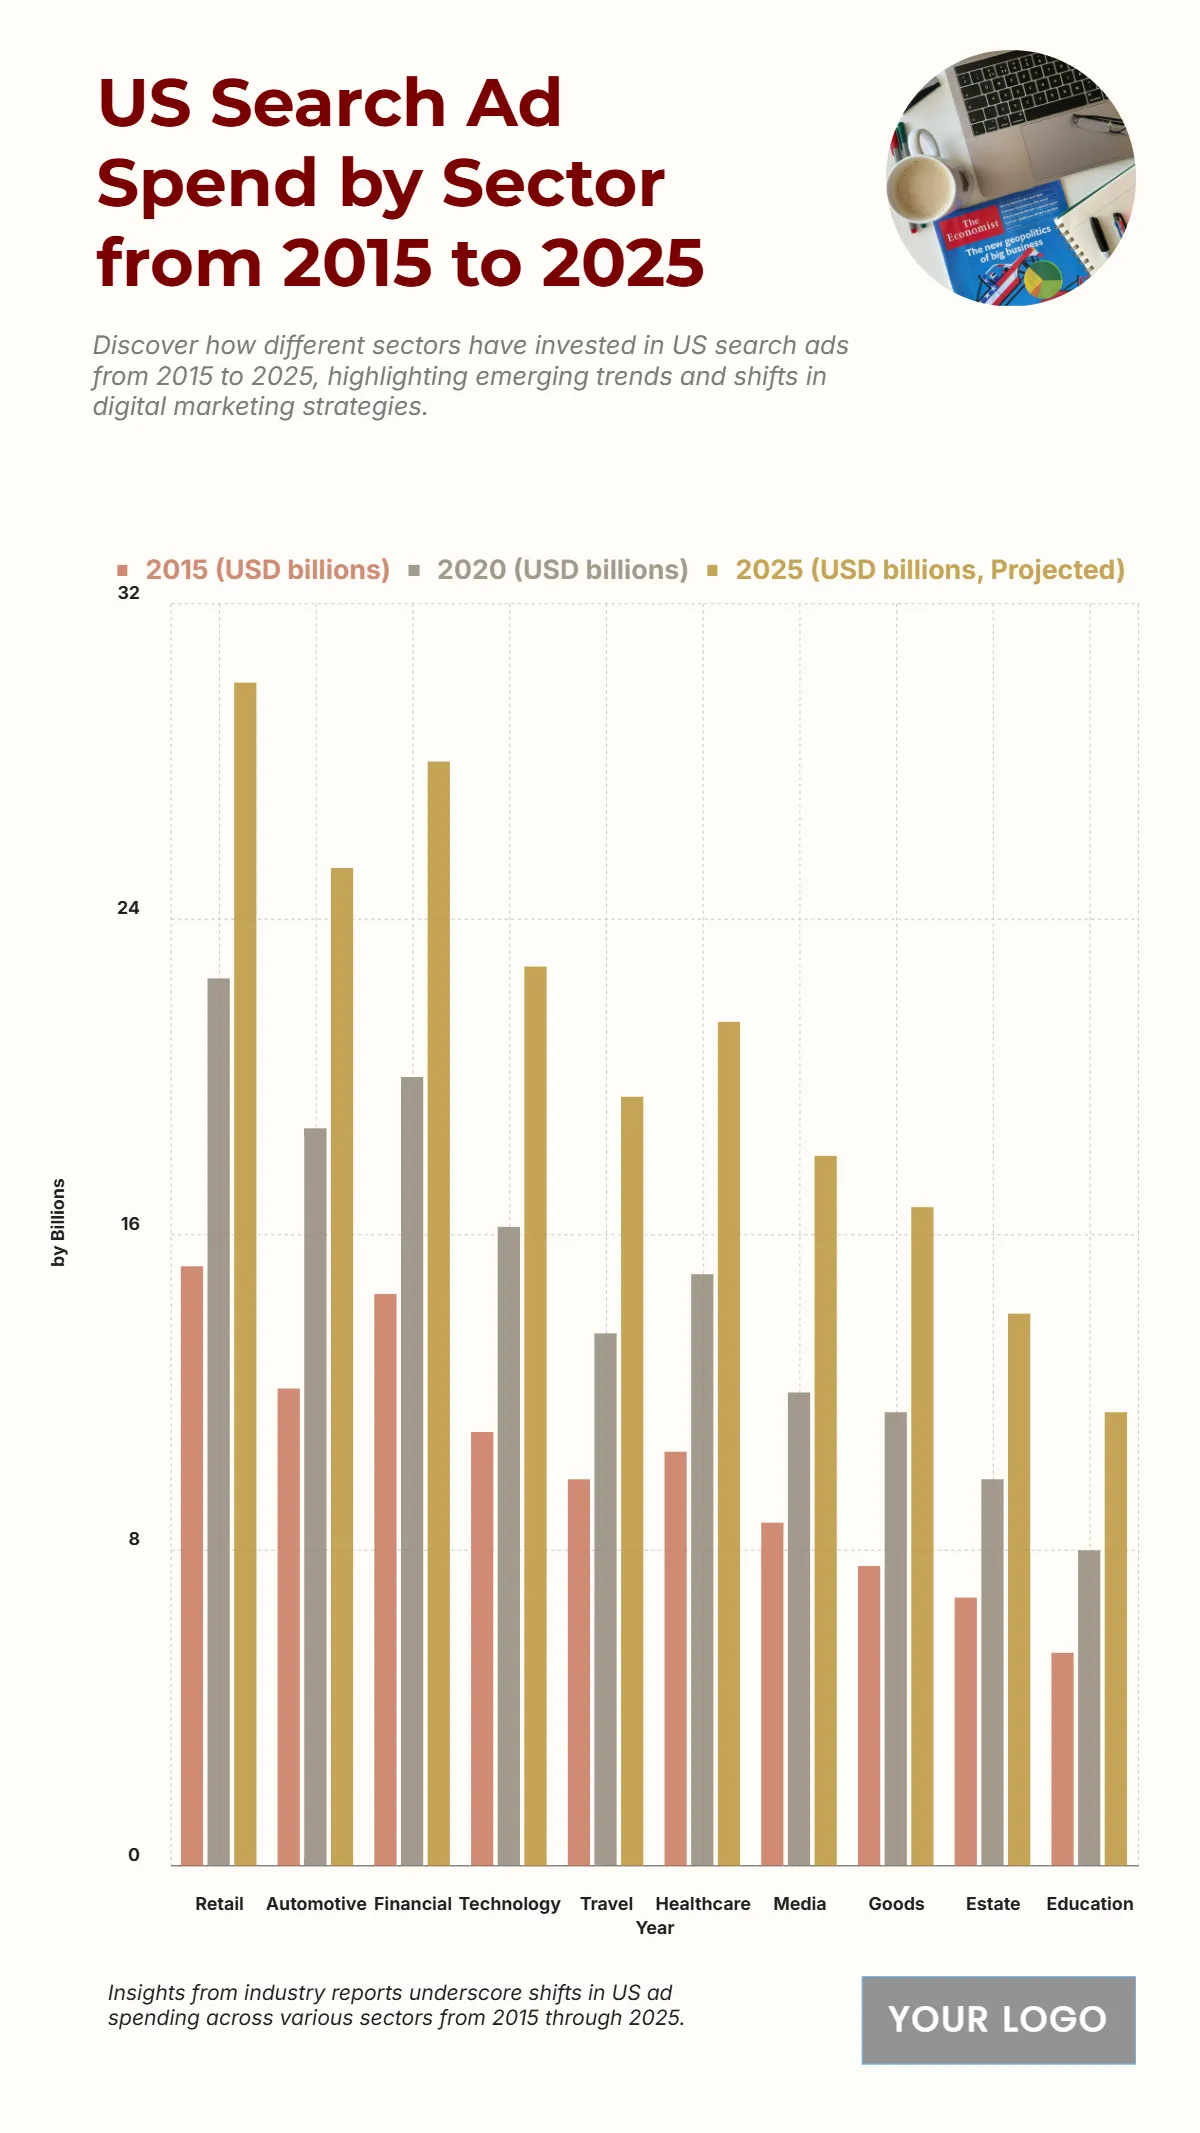
The chart shows a notable rise in U.S. search ad spending across multiple sectors from 2015 to 2025, highlighting evolving digital marketing strategies. Retail remains the leading sector, increasing from $15.2 billion in 2015 to $22.5 billion in 2020, and projected to reach $30 billion in 2025, emphasizing its dominance in online advertising. Automotive follows closely, growing from $12.1 billion to $18.7 billion and expected to hit $25.3 billion. The financial sector also shows strong growth, climbing from $14.5 billion to $28 billion. Other key sectors like technology and healthcare are projected to rise to $22.8 billion and $21.4 billion by 2025 respectively. Even traditionally lower-spending industries such as education and real estate are expected to grow significantly, indicating a broader adoption of search advertising across industries. Overall, the data illustrates a strong, diversified expansion of digital ad investments.
| Labels | 2015 (USD billions) | 2020 (USD billions) | 2025 (USD billions, Projected) |
|---|---|---|---|
| Retail | 15.2 | 22.5 | 30 |
| Automotive | 12.1 | 18.7 | 25.3 |
| Financial | 14.5 | 20 | 28 |
| Technology | 11 | 16.2 | 22.8 |
| Travel | 9.8 | 13.5 | 19.5 |
| Healthcare | 10.5 | 15 | 21.4 |
| Media | 8.7 | 12 | 18 |
| Goods | 7.6 | 11.5 | 16.7 |
| Estate | 6.8 | 9.8 | 14 |
| Education | 5.4 | 8 | 11.5 |


