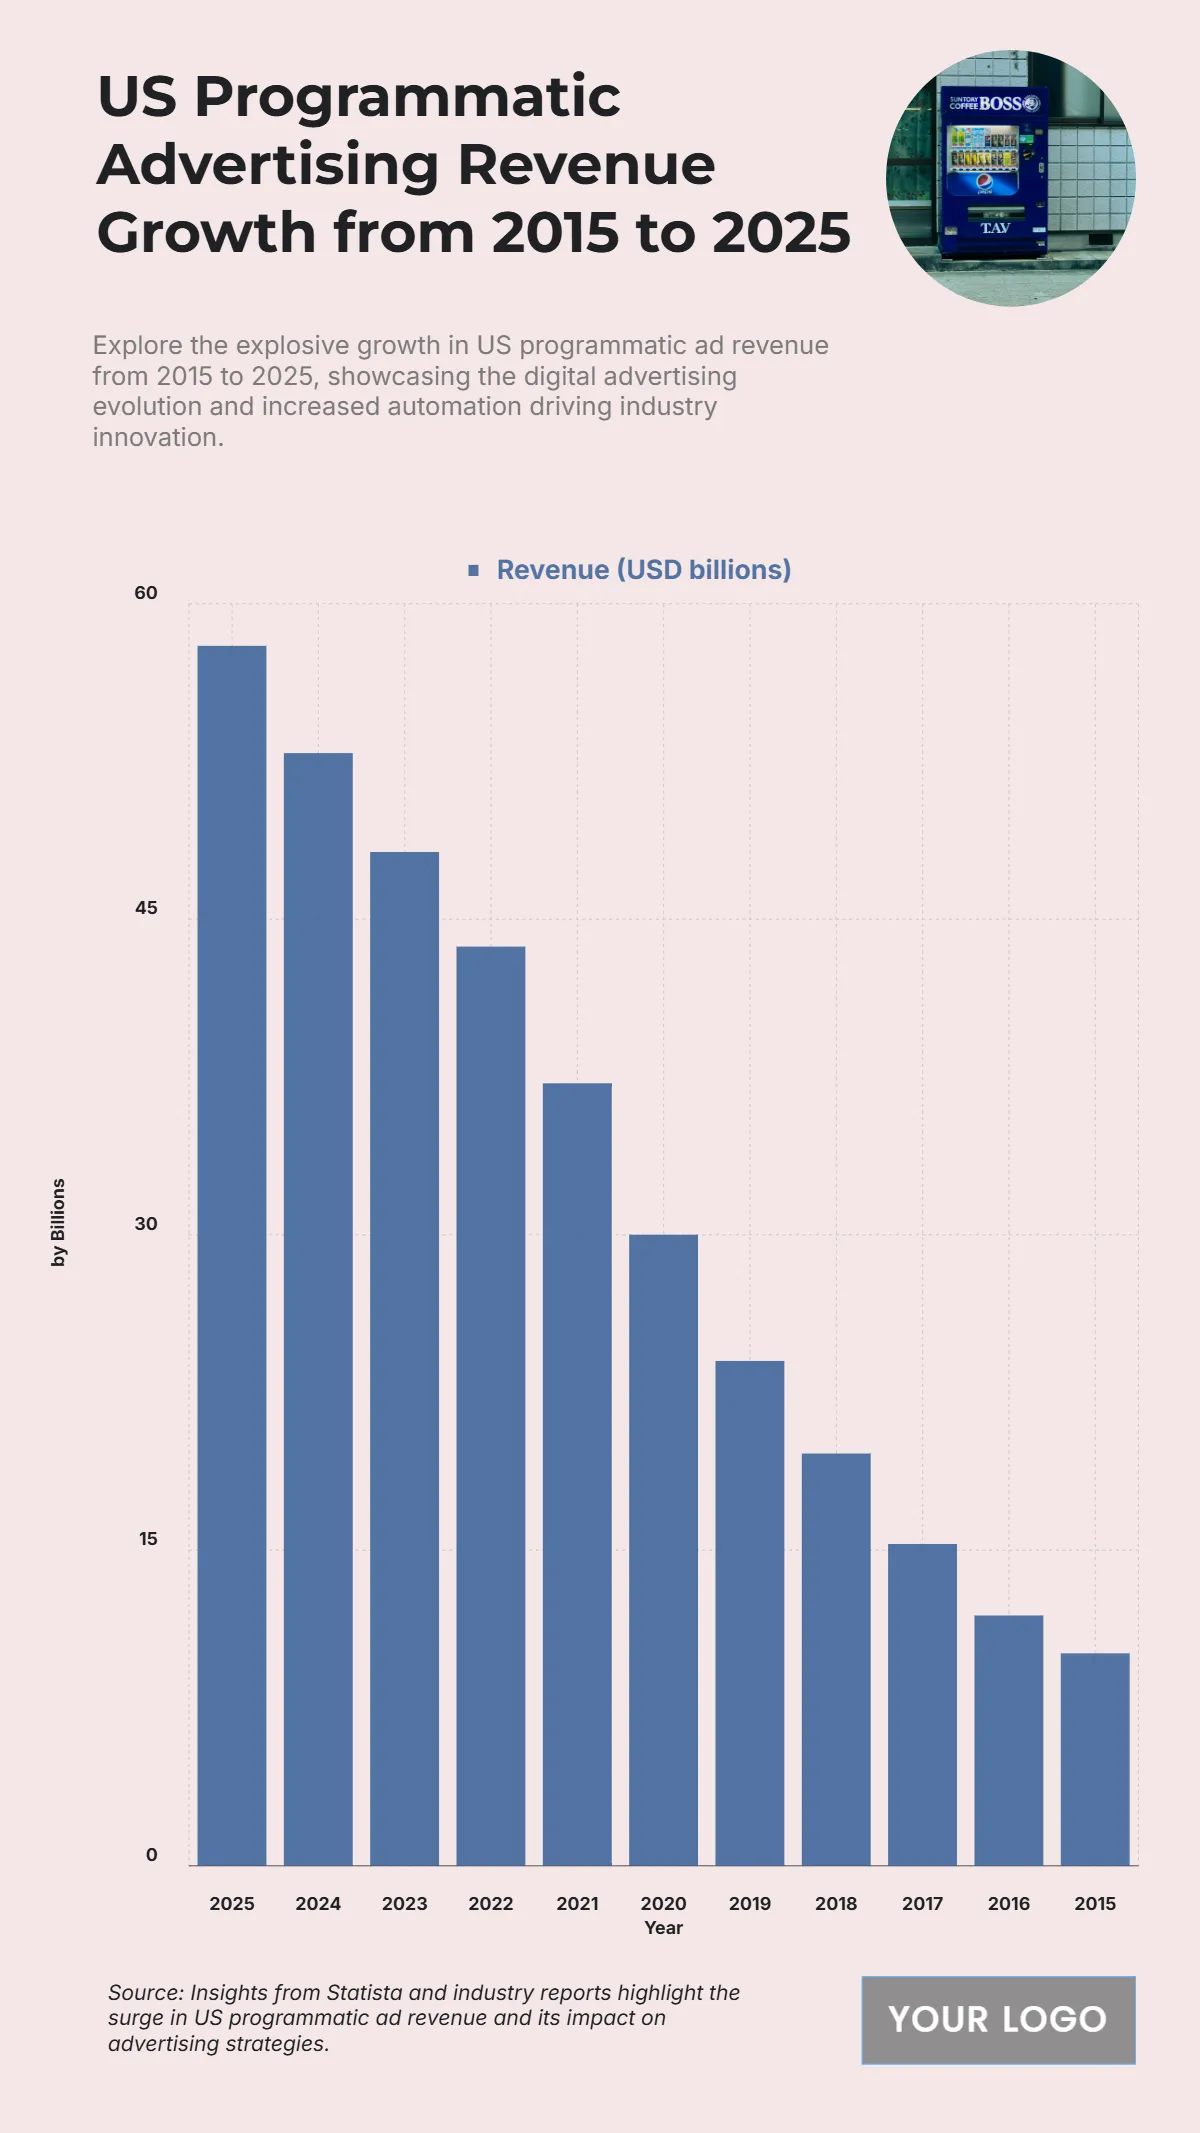
Free US Programmatic Advertising Revenue Growth from 2015 to 2025 Chart
The chart highlights a strong upward trajectory in U.S. programmatic advertising revenue from 2015 to 2025, showcasing how automation and digital innovation have transformed the advertising landscape. Revenue grew from $10.1 billion in 2015 to $11.9 billion in 2016 and continued accelerating to $19.6 billion by 2018. A major surge occurred after 2020, rising from $30 billion in 2020 to $37.2 billion in 2021 and $43.7 billion in 2022. By 2023, it reached $48.2 billion, climbing further to $52.9 billion in 2024, and is projected to peak at $58 billion in 2025. This sustained growth reflects advertisers’ increasing reliance on automated ad buying, advanced targeting, and real-time bidding technologies to optimize campaigns. Programmatic advertising has clearly become a central pillar in digital marketing strategies.
| Labels | Revenue (USD billions) |
|---|---|
| 2025 | 58 |
| 2024 | 52.9 |
| 2023 | 48.2 |
| 2022 | 43.7 |
| 2021 | 37.2 |
| 2020 | 30 |
| 2019 | 24 |
| 2018 | 19.6 |
| 2017 | 15.3 |
| 2016 | 11.9 |
| 2015 | 10.1 |


