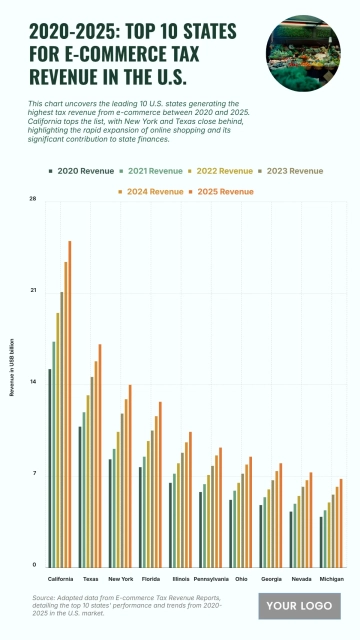
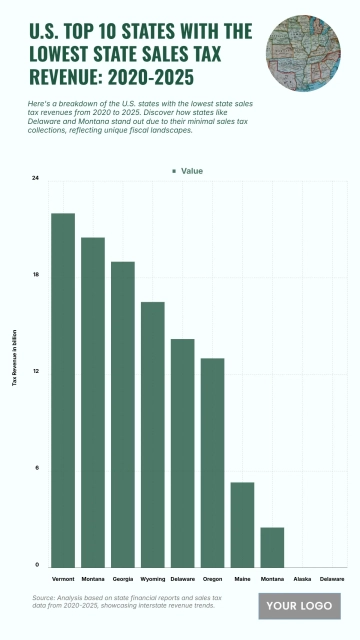
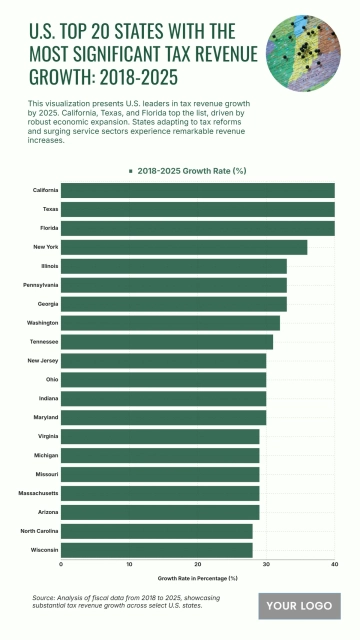
An informative 9:16 infographic chart for comparing tax revenue per capita across ten U.S. states, professionally designed by Template.net, with a ten-bar column chart, a circular dollar bill photo and a headline in teal green, dark green and pale mint.