Free US Mobile Ad Impressions by Platform from 2015 to 2025 Chart
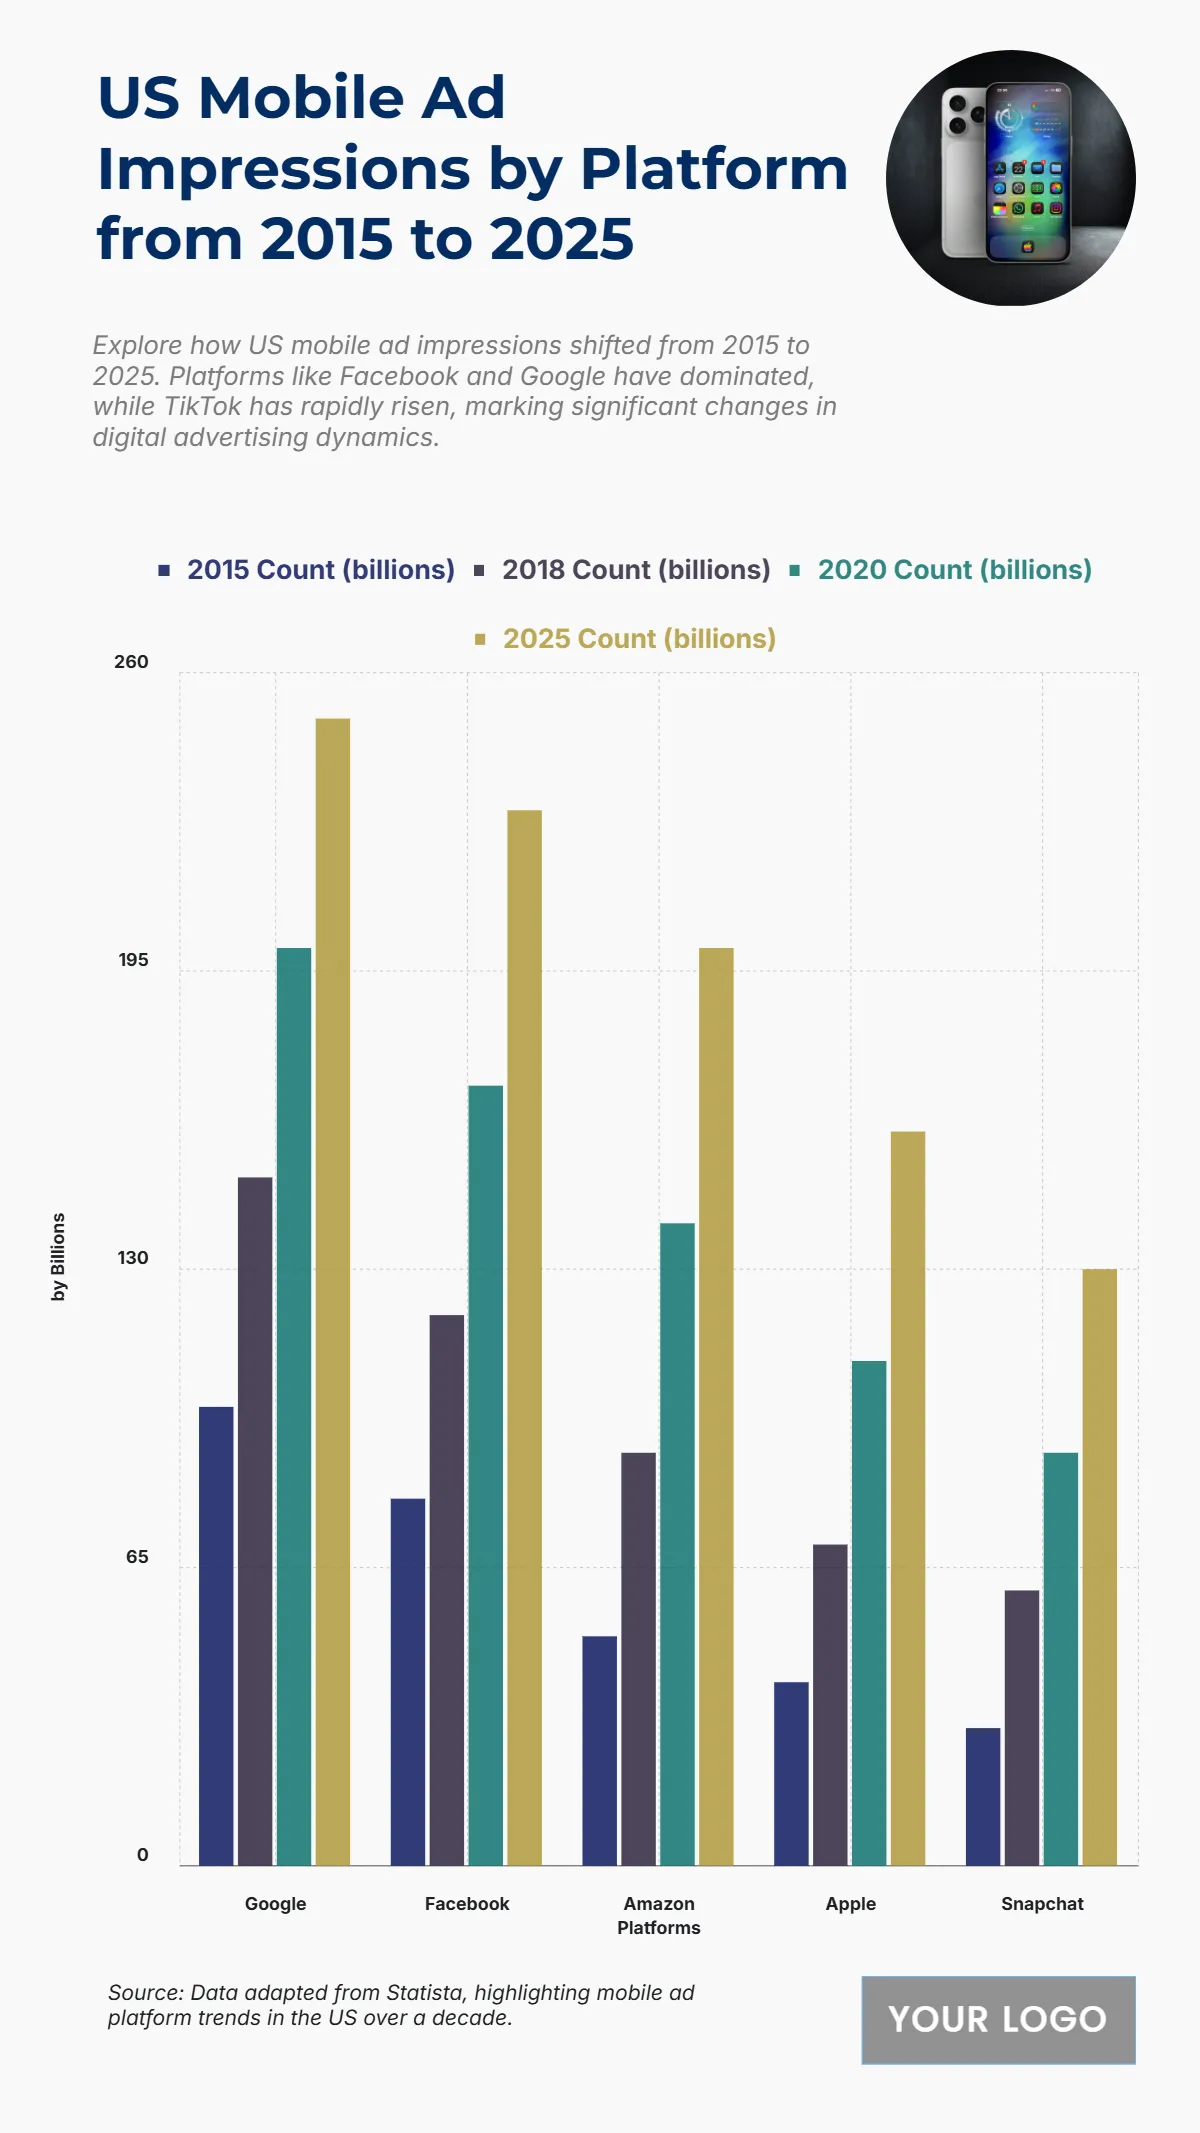
The chart shows a strong surge in U.S. mobile ad impressions across major platforms between 2015 and 2025, illustrating how digital advertising has rapidly scaled. Google leads consistently, rising from 100 billion impressions in 2015 to 250 billion by 2025. Facebook follows closely, growing from 80 billion to 230 billion. Amazon demonstrates one of the steepest climbs, surging from 50 billion in 2015 to 200 billion in 2025, reflecting its increasing dominance in retail media. Apple also expands from 40 billion to 160 billion, while Snapchat grows from 30 billion to 130 billion. This upward trend emphasizes the central role of mobile platforms in digital marketing strategies, with all five platforms experiencing exponential growth over the decade.
| Labels | 2015 Count (billions) | 2018 Count (billions) | 2020 Count (billions) | 2025 Count (billions) |
|---|---|---|---|---|
| 100 | 150 | 200 | 250 | |
| 80 | 120 | 170 | 230 | |
| Amazon | 50 | 90 | 140 | 200 |
| Apple | 40 | 70 | 110 | 160 |
| Snapchat | 30 | 60 | 90 | 130 |


