Free US Retail Advertising by Medium from 2020 to 2025 Chart
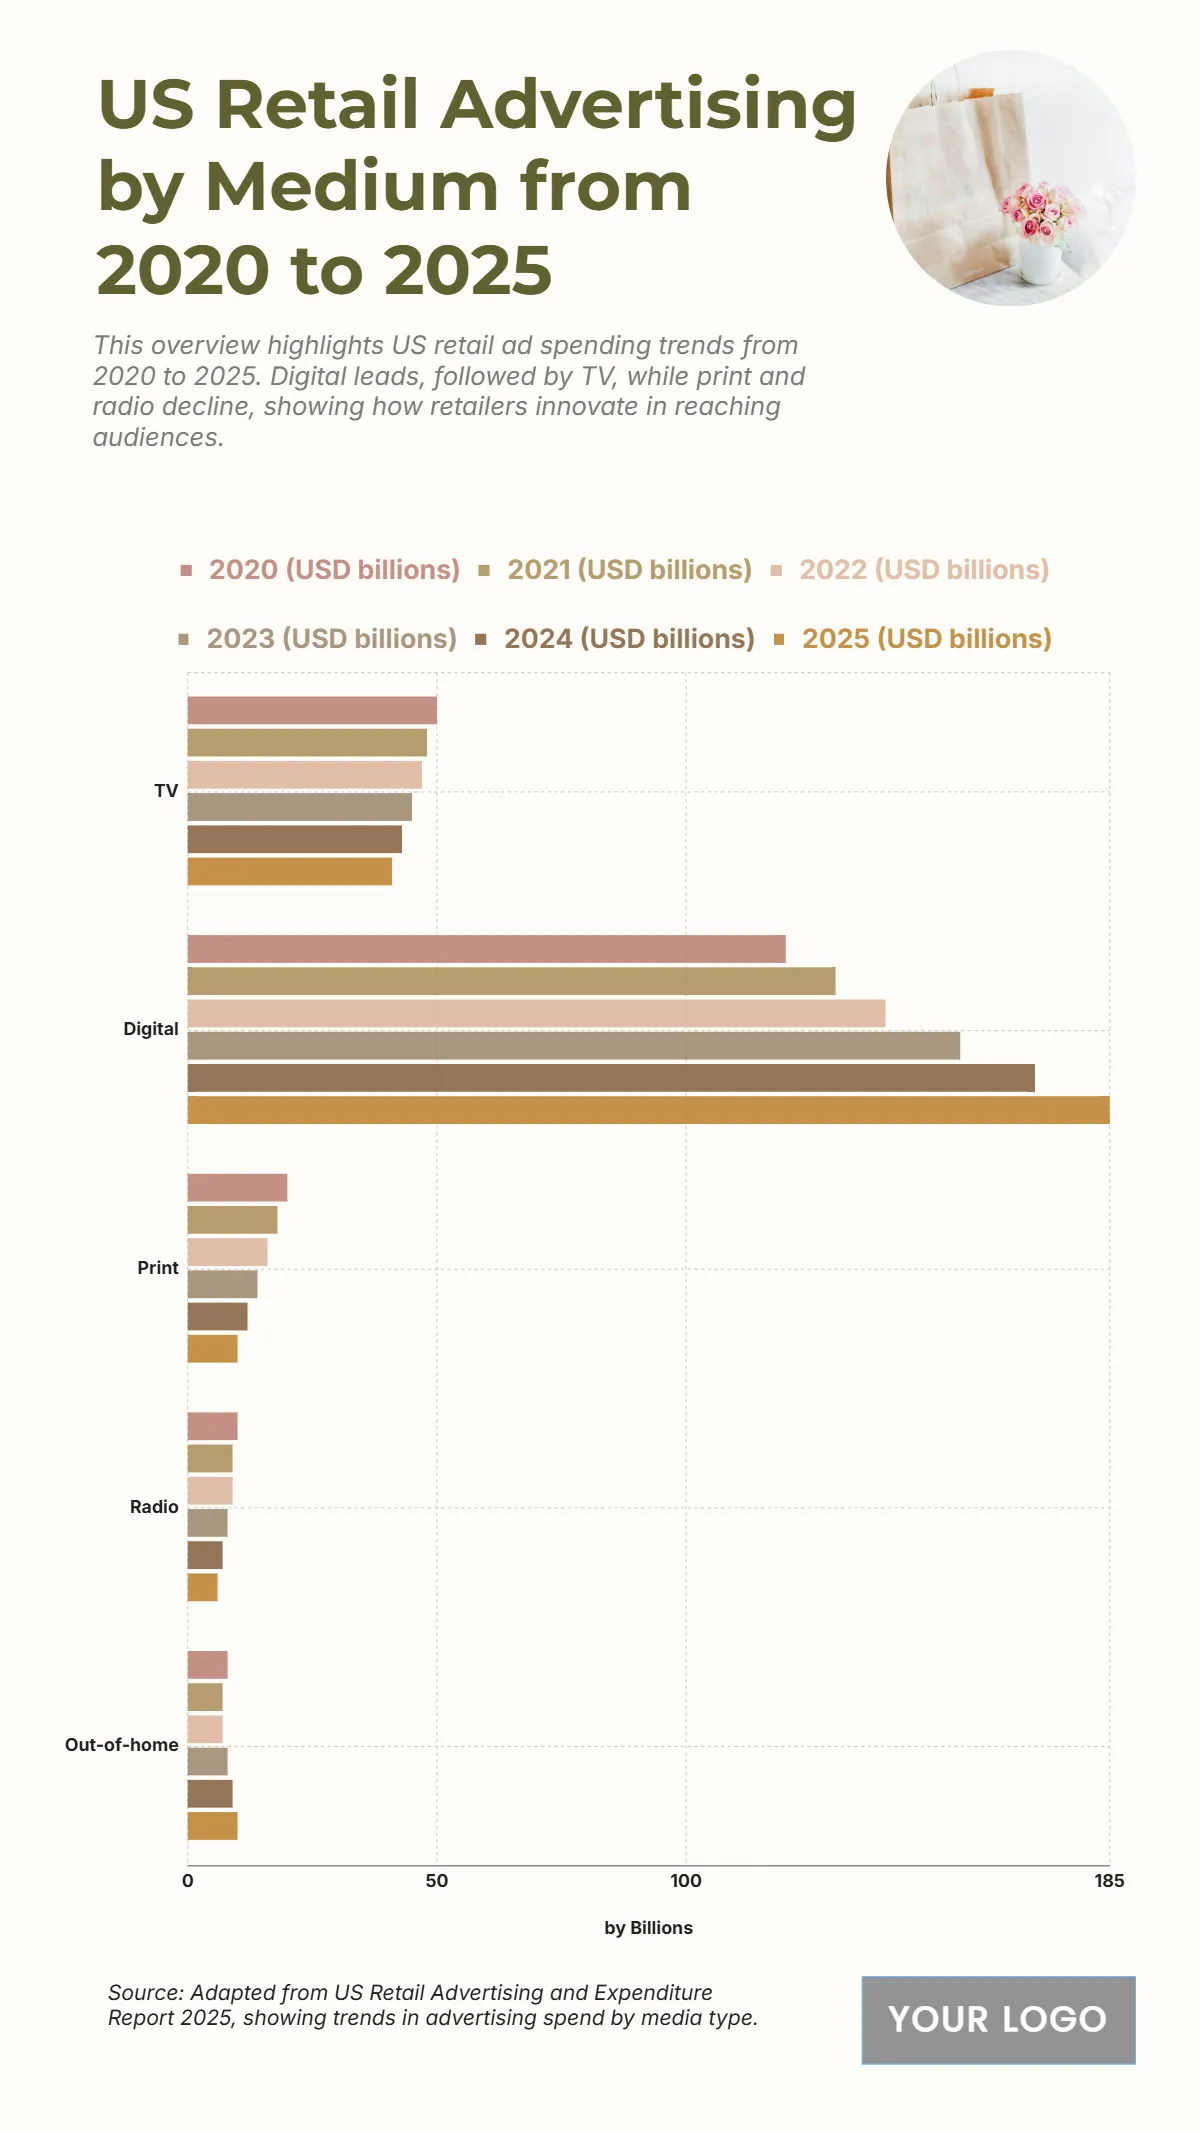
The chart illustrates a major shift in U.S. retail advertising spend by medium from 2020 to 2025, with Digital channels dominating the landscape. Digital ad spending is projected to climb from $120 billion in 2020 to $185 billion by 2025, highlighting a strong preference for online marketing strategies. Meanwhile, TV ad spending shows a gradual decline from $50 billion in 2020 to $41 billion in 2025, reflecting changing viewer habits. Print advertising falls from $20 billion to $10 billion, while Radio decreases modestly from $10 billion to $6 billion. Interestingly, Out-of-home advertising shows a slight rebound — from $8 billion in 2020 to $10 billion in 2025 — likely driven by integrated campaigns combining physical and digital presence. These shifts signal a clear prioritization of digital platforms over traditional media in retail advertising strategies.
| Labels | 2020 (USD billions) | 2021 (USD billions) | 2022 (USD billions) | 2023 (USD billions) | 2024 (USD billions) | 2025 (USD billions) |
|---|---|---|---|---|---|---|
| TV | 50 | 48 | 47 | 45 | 43 | 41 |
| Digital | 120 | 130 | 140 | 155 | 170 | 185 |
| 20 | 18 | 16 | 14 | 12 | 10 | |
| Radio | 10 | 9 | 9 | 8 | 7 | 6 |
| Out-of-home | 8 | 7 | 7 | 8 | 9 | 10 |


