Free US Connected TV Ad Spend vs Linear TV from 2015 to 2025 Chart
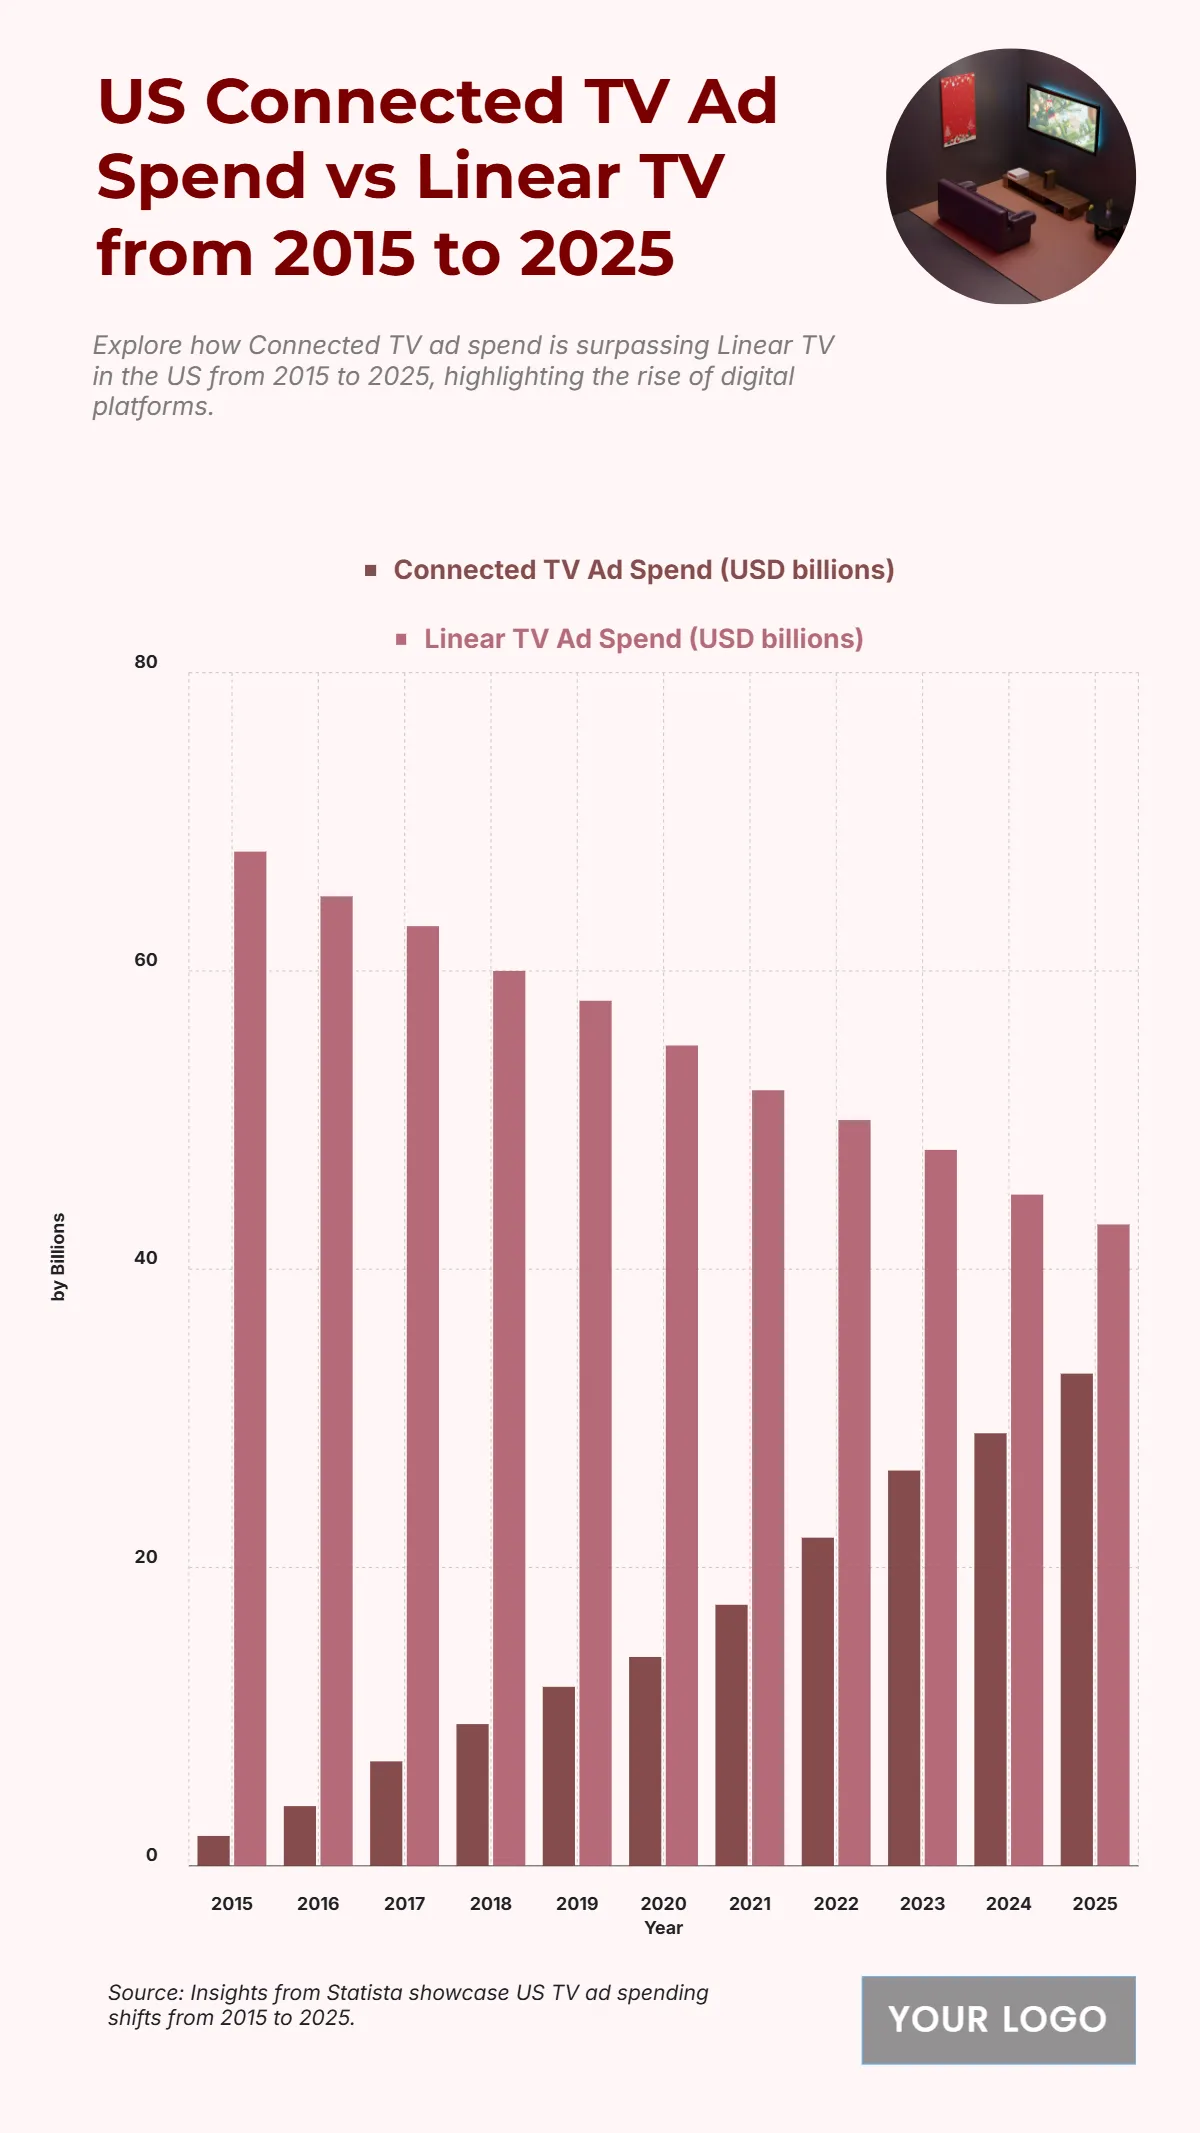
The chart highlights a clear shift in U.S. advertising spend from Linear TV to Connected TV between 2015 and 2025, showcasing the rapid adoption of digital platforms. Linear TV ad spend started at $68 billion in 2015, gradually declining to $55 billion by 2020, and is projected to fall further to $43 billion by 2025. In contrast, Connected TV ad spend rose sharply from just $2 billion in 2015 to $14 billion in 2020, with steady growth expected to reach $33 billion by 2025. This trend illustrates how advertisers are increasingly favoring streaming and digital platforms over traditional TV to reach audiences. The narrowing gap between the two formats underscores a major transformation in media consumption and ad strategies.
| Labels | Connected TV Ad Spend (USD billions) | Linear TV Ad Spend (USD billions) |
|---|---|---|
| 2015 | 2 | 68 |
| 2016 | 4 | 65 |
| 2017 | 7 | 63 |
| 2018 | 9.5 | 60 |
| 2019 | 12 | 58 |
| 2020 | 14 | 55 |
| 2021 | 17.5 | 52 |
| 2022 | 22 | 50 |
| 2023 | 26.5 | 48 |
| 2024 | 29 | 45 |
| 2025 | 33 | 43 |


