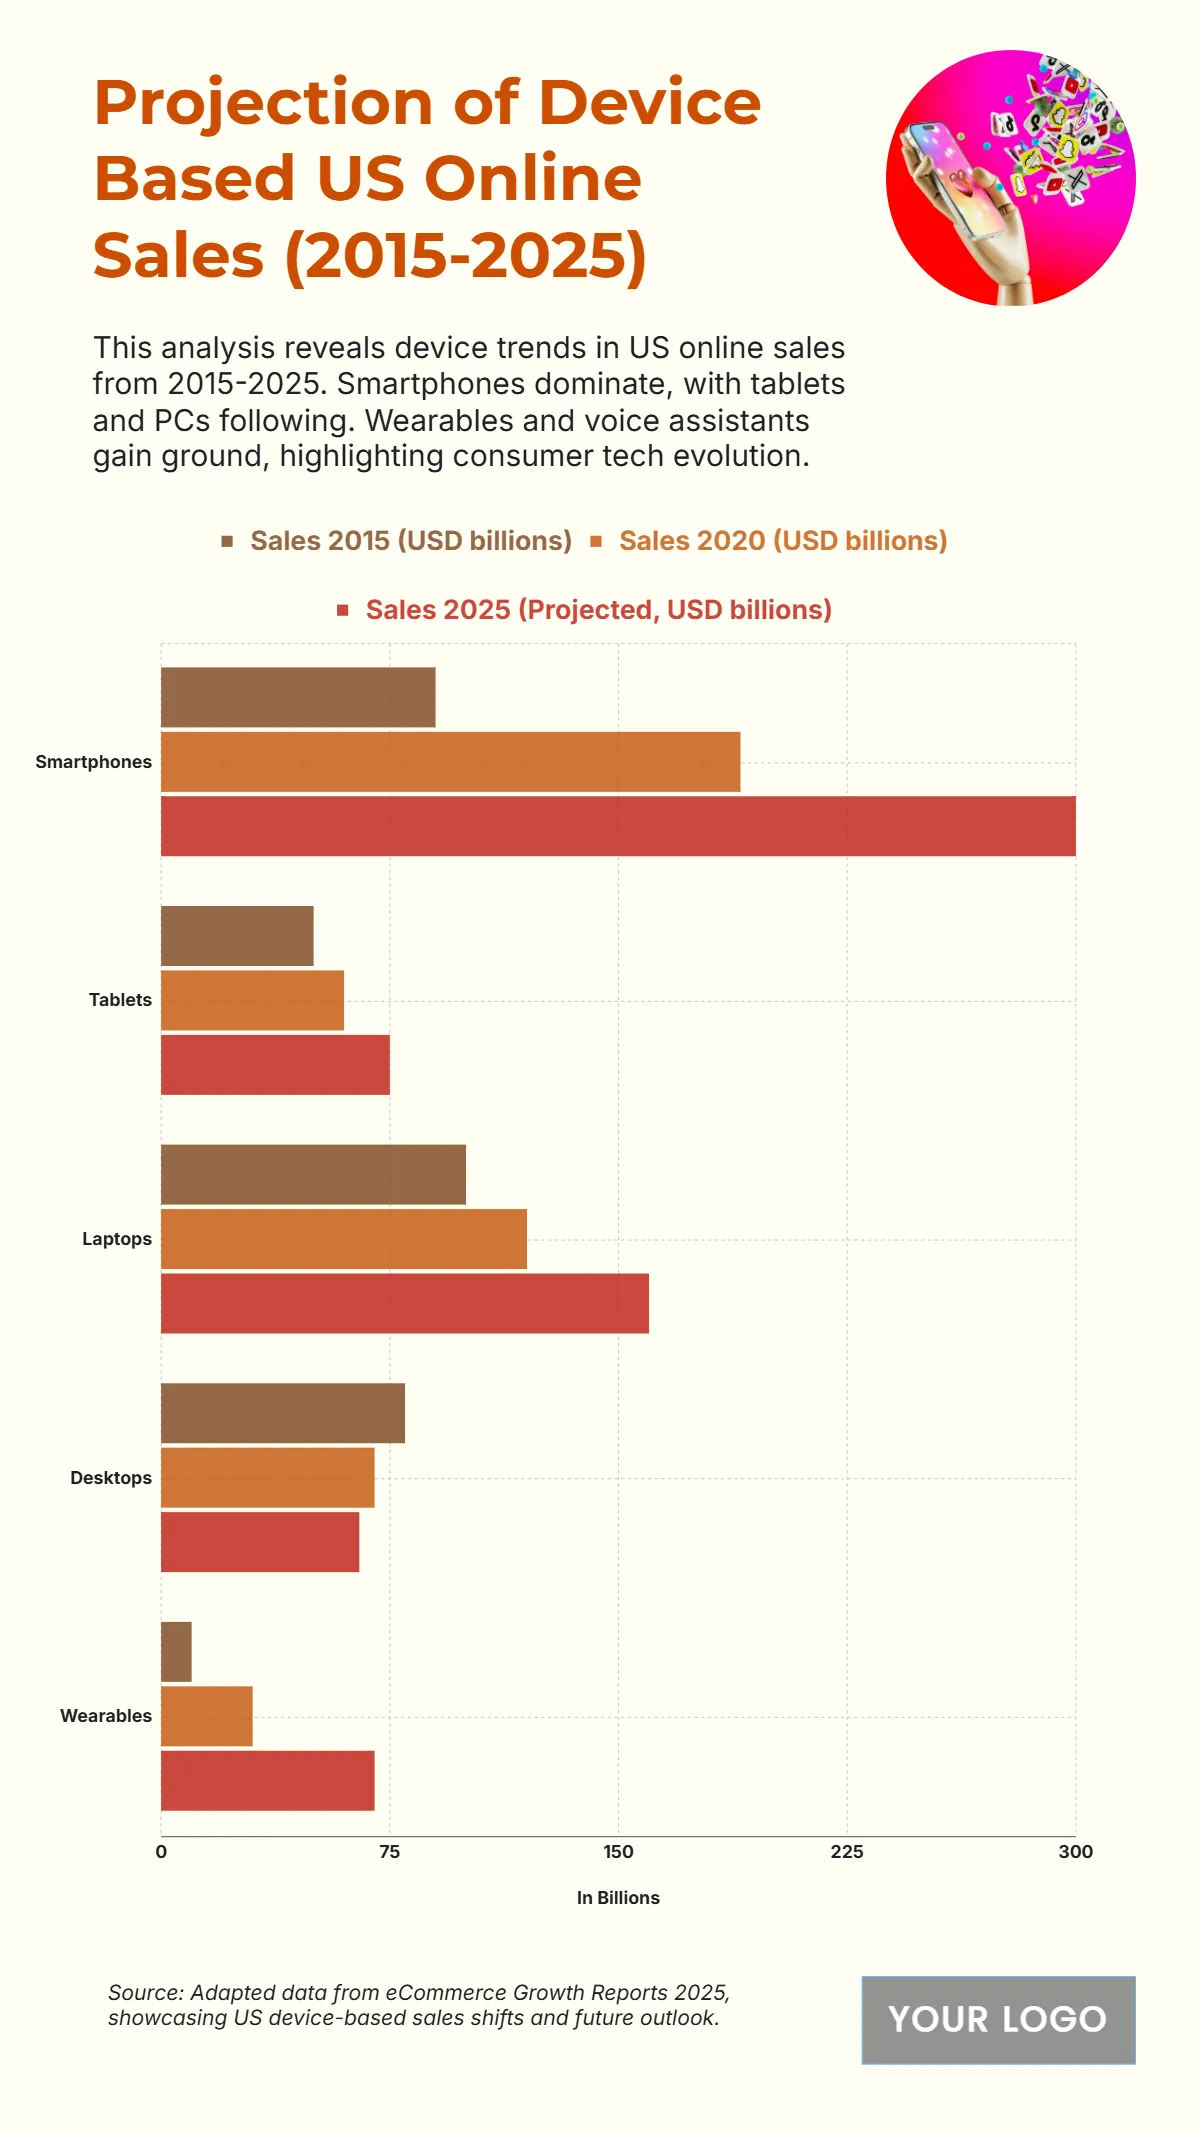
Free US Online Retail Sales Distribution by Device from 2015 to 2025
The chart projects U.S. online sales by device type from 2015 to 2025, underscoring the dominance of mobile commerce and emerging digital technologies. Smartphones lead overwhelmingly, with sales rising from around USD 100 billion in 2015 to USD 200 billion in 2020, and projected to surpass USD 300 billion by 2025, illustrating consumers’ growing reliance on mobile shopping and app-based transactions. Laptops maintain steady growth, increasing from roughly USD 100 billion to 160 billion, as they remain essential for productivity and larger-screen browsing experiences. Tablets, while showing slower progress, still grow modestly from USD 50 billion in 2015 to USD 90 billion by 2025, indicating sustained use among casual and household shoppers. Desktop sales continue to decline slightly, dropping from USD 90 billion to about 70 billion, reflecting the migration to portable and mobile-first platforms. Wearables, though starting from a minimal base, show notable momentum—rising from USD 10 billion to nearly 60 billion—as smartwatches and voice-enabled devices expand e-commerce accessibility. Overall, the chart highlights a clear shift toward mobile and connected device transactions, confirming that by 2025, smartphone-driven sales will define the U.S. digital retail landscape.
| Labels | Sales 2015 (USD billions) | Sales 2020 (USD billions) |
Sales 2025 (Projected, USD billions) |
| Smartphones | 90 | 190 | 300 |
| Tablets | 50 | 60 | 75 |
| Laptops | 100 | 120 | 160 |
| Desktops | 80 | 70 | 65 |
| Wearables | 10 | 30 | 70 |


