Free US Digital Advertising Spend by Platform from 2015 to 2025 Chart
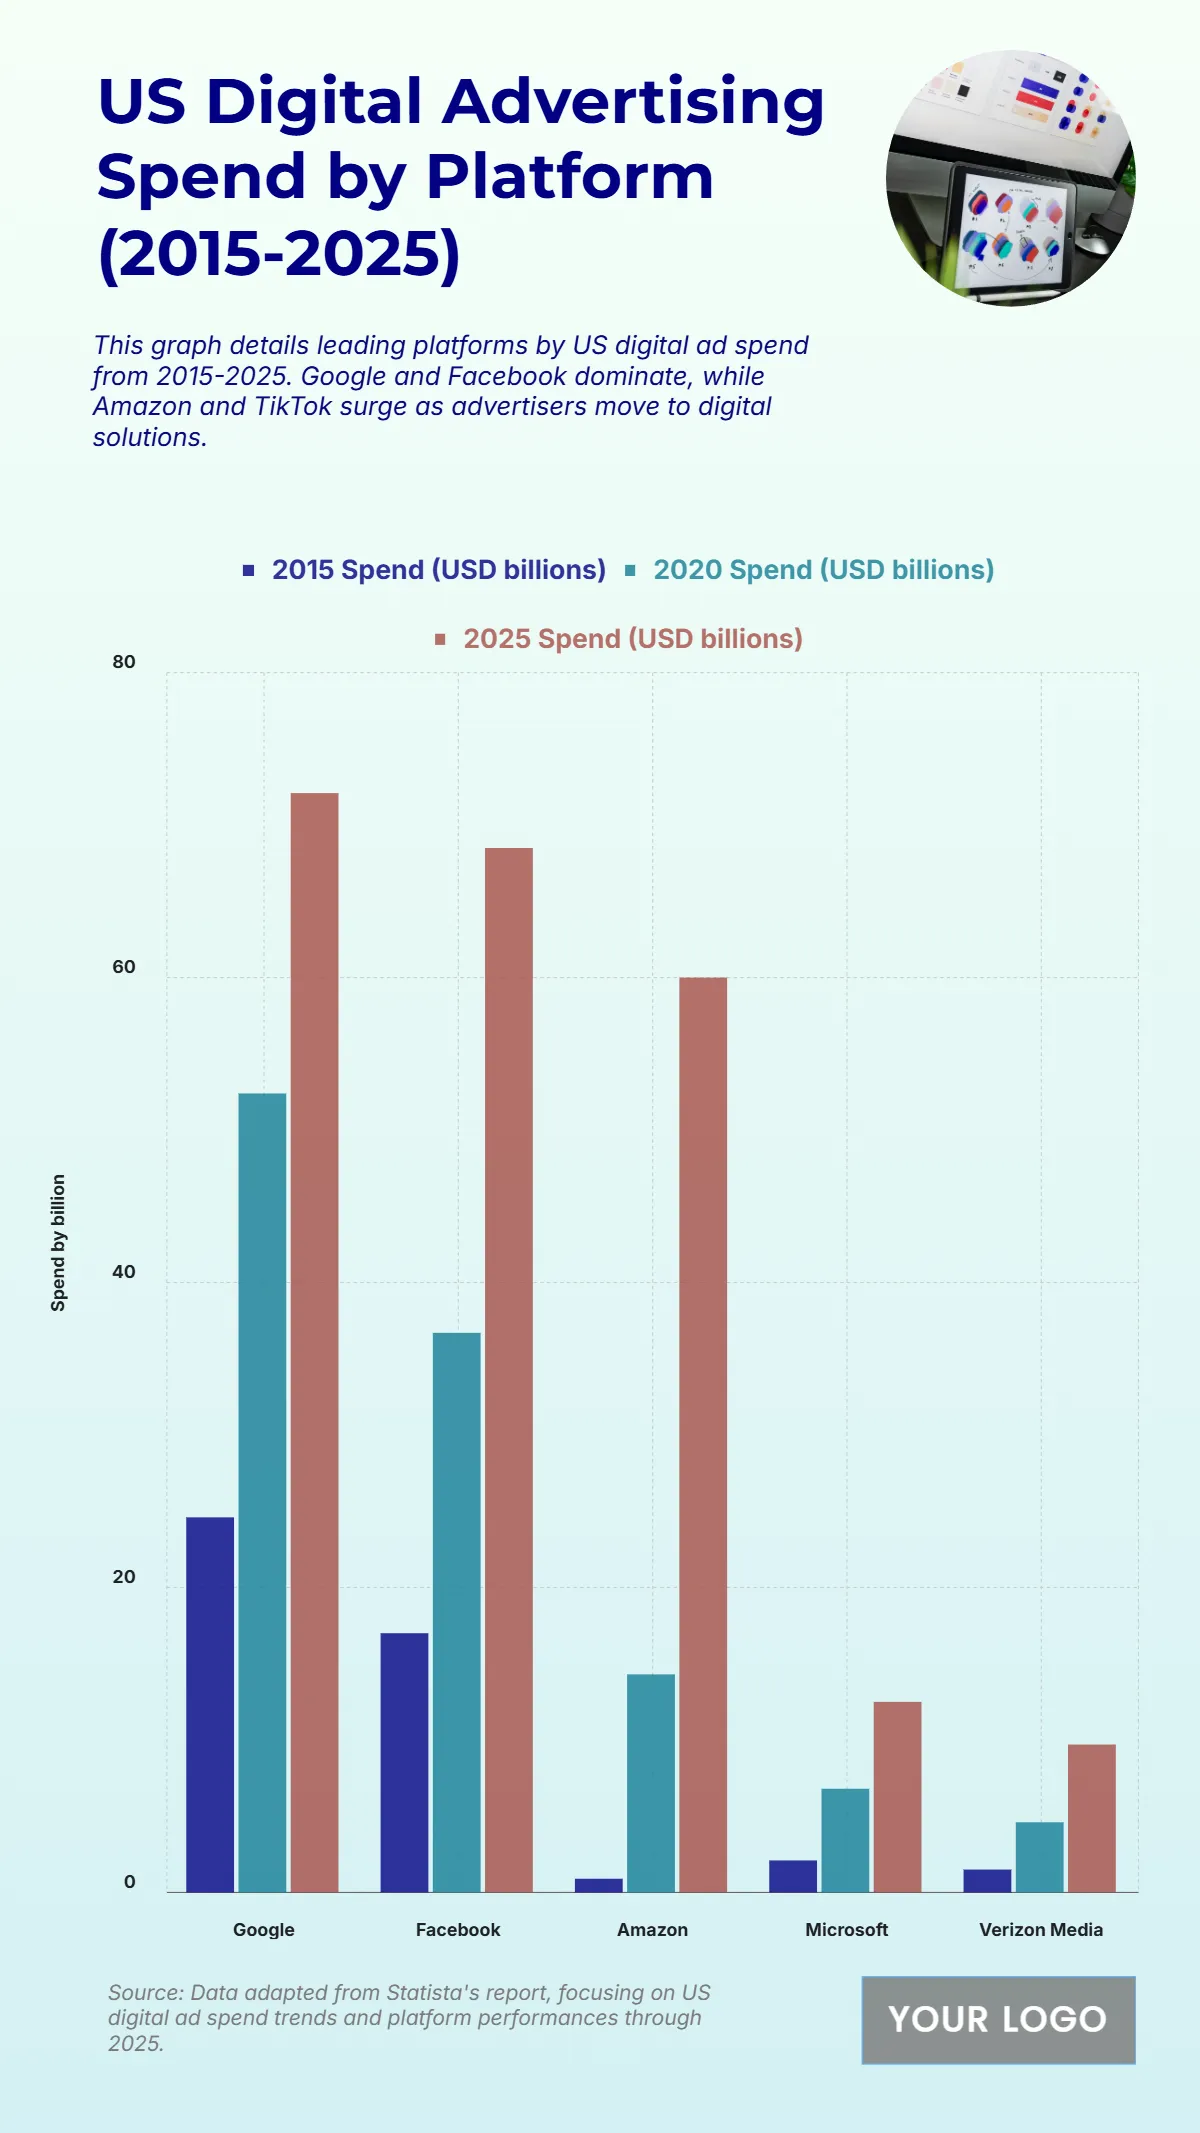
The chart reveals a significant surge in U.S. digital advertising spend across major platforms between 2015 and 2025, underscoring the dominance of tech giants in online marketing. Google leads, growing from $24.6 billion in 2015 to $52.4 billion in 2020, and reaching a projected $72.1 billion in 2025, reflecting its strong hold on digital ad revenue. Facebook follows, increasing from $17 billion in 2015 to $68.5 billion in 2025, highlighting its sustained advertising appeal. Amazon exhibits the fastest growth, skyrocketing from just $0.9 billion in 2015 to $60 billion by 2025, indicating its emergence as a major ad player. Meanwhile, Microsoft and Verizon Media show steady but more modest gains, with $12.5 billion and $9.7 billion projected by 2025 respectively. This trend clearly demonstrates how Google, Facebook, and Amazon dominate the digital ad ecosystem, shaping the future of advertising investments.
| Labels | 2015 Spend (USD billions) | 2020 Spend (USD billions) | 2025 Spend (USD billions) |
|---|---|---|---|
| 24.6 | 52.4 | 72.1 | |
| 17 | 36.7 | 68.5 | |
| Amazon | 0.9 | 14.3 | 60 |
| Microsoft | 2.1 | 6.8 | 12.5 |
| Verizon Media | 1.5 | 4.6 | 9.7 |


