Free US Mobile Advertising Growth Trends from 2015 to 2025 Chart
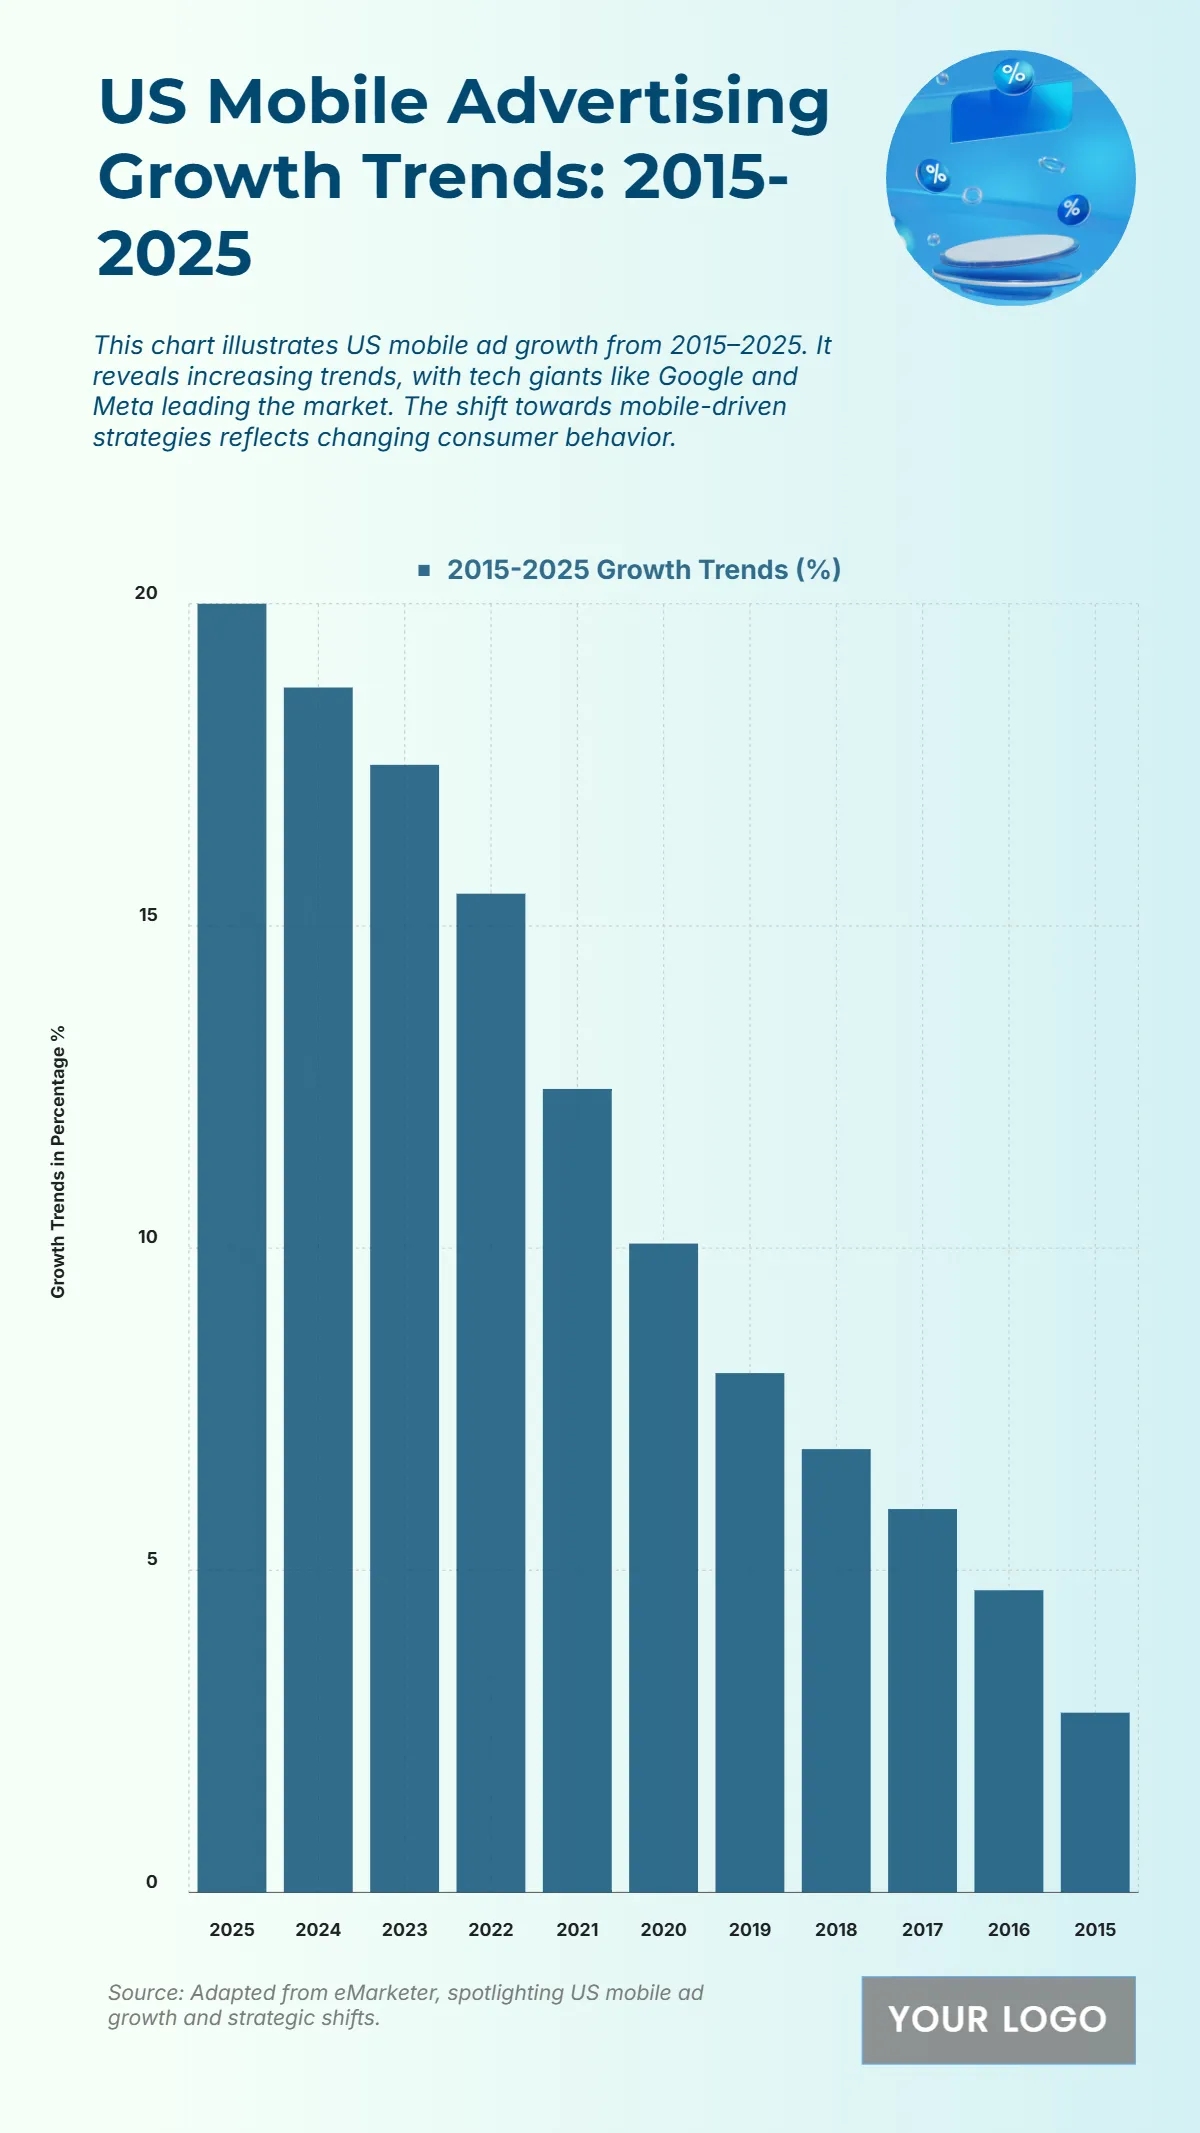
The chart shows a steady upward trajectory in U.S. mobile advertising growth from 2015 to 2025, with the sharpest increases occurring in the most recent years. Growth began modestly at 2.79% in 2015, rising gradually through 4.69% in 2016 and 8.06% in 2019. A notable acceleration occurs starting 2020, with growth reaching 10.07%, followed by double-digit rates in the subsequent years. By 2023, growth hit 17.5%, and it’s projected to peak at 20% in 2025. This upward trend reflects advertisers’ shift toward mobile platforms, driven by consumer behavior and the dominance of major tech companies. Mobile advertising has transformed from a secondary channel to a primary investment area, mirroring the mobile-first digital landscape.
| Labels | 2015–2025 Growth Trends (%) |
|---|---|
| 2025 | 20 |
| 2024 | 18.7 |
| 2023 | 17.5 |
| 2022 | 15.5 |
| 2021 | 12.47 |
| 2020 | 10.07 |
| 2019 | 8.06 |
| 2018 | 6.88 |
| 2017 | 5.95 |
| 2016 | 4.69 |
| 2015 | 2.79 |


