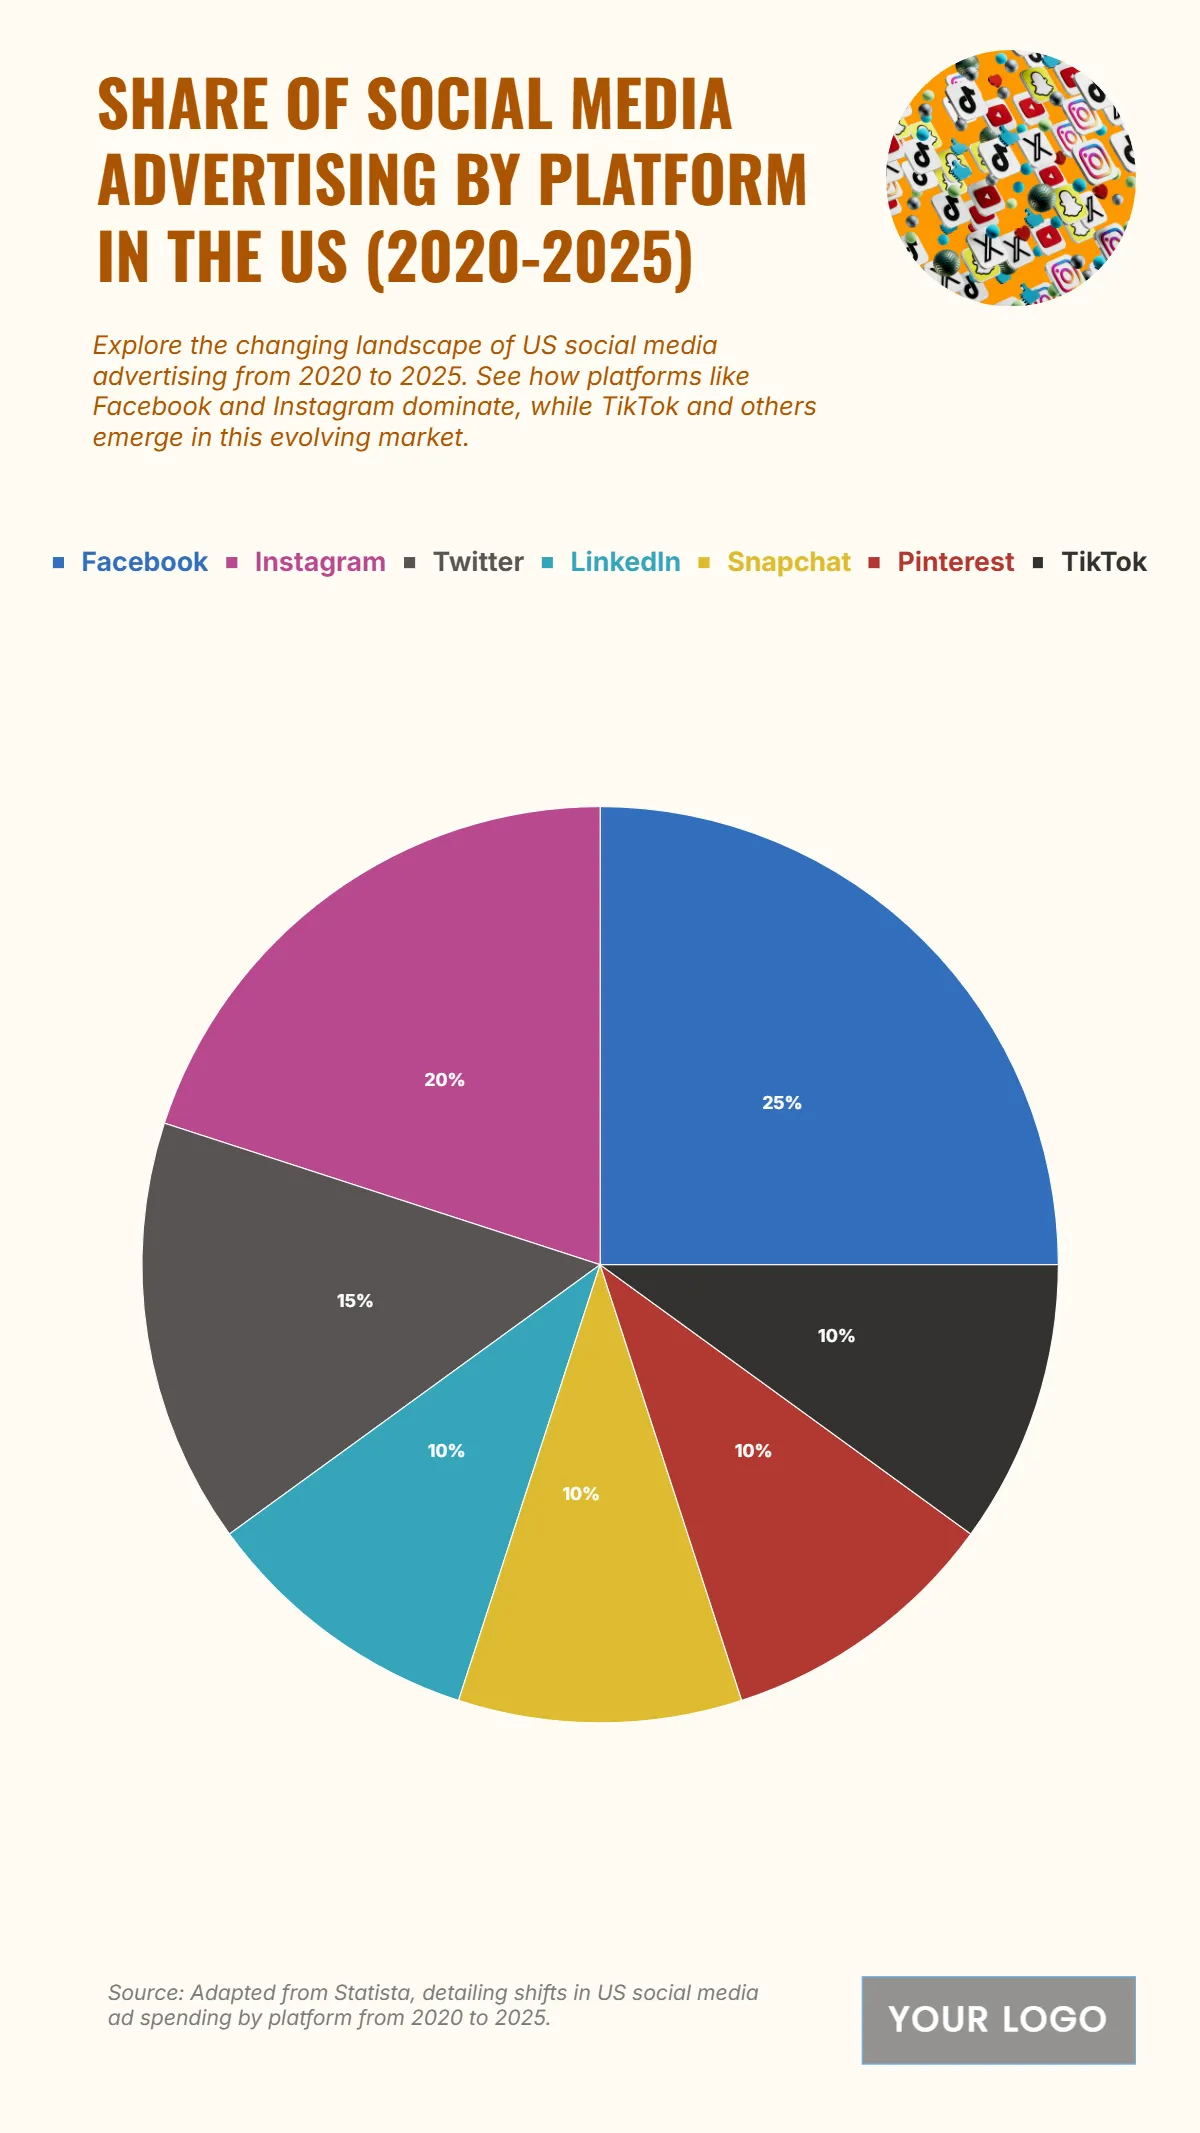
Free Share of Social Media Advertising by Platform in the US from 2020 to 2025 Chart
The chart illustrates the distribution of U.S. social media advertising share by platform from 2020 to 2025, revealing how major platforms compete for ad spend. Facebook dominates the market with 25%, emphasizing its strong role as a leading channel for advertisers. Instagram follows closely at 20%, reflecting its continued strength in visual and influencer marketing. Twitter holds 15%, maintaining a solid share as a conversational and trending platform. Meanwhile, LinkedIn, Snapchat, Pinterest, and TikTok each secure 10%, indicating a more balanced ad distribution among emerging and niche platforms. This spread highlights a shift toward diversified advertising strategies, where brands leverage multiple social channels to reach specific audiences and demographics.
| Labels | 2020–2025 Advertising Share (%) |
|---|---|
| 25 | |
| 20 | |
| 15 | |
| 10 | |
| Snapchat | 10 |
| 10 | |
| TikTok | 10 |


