Free US Search Advertising Revenue Trends from 2015 to 2025 Chart
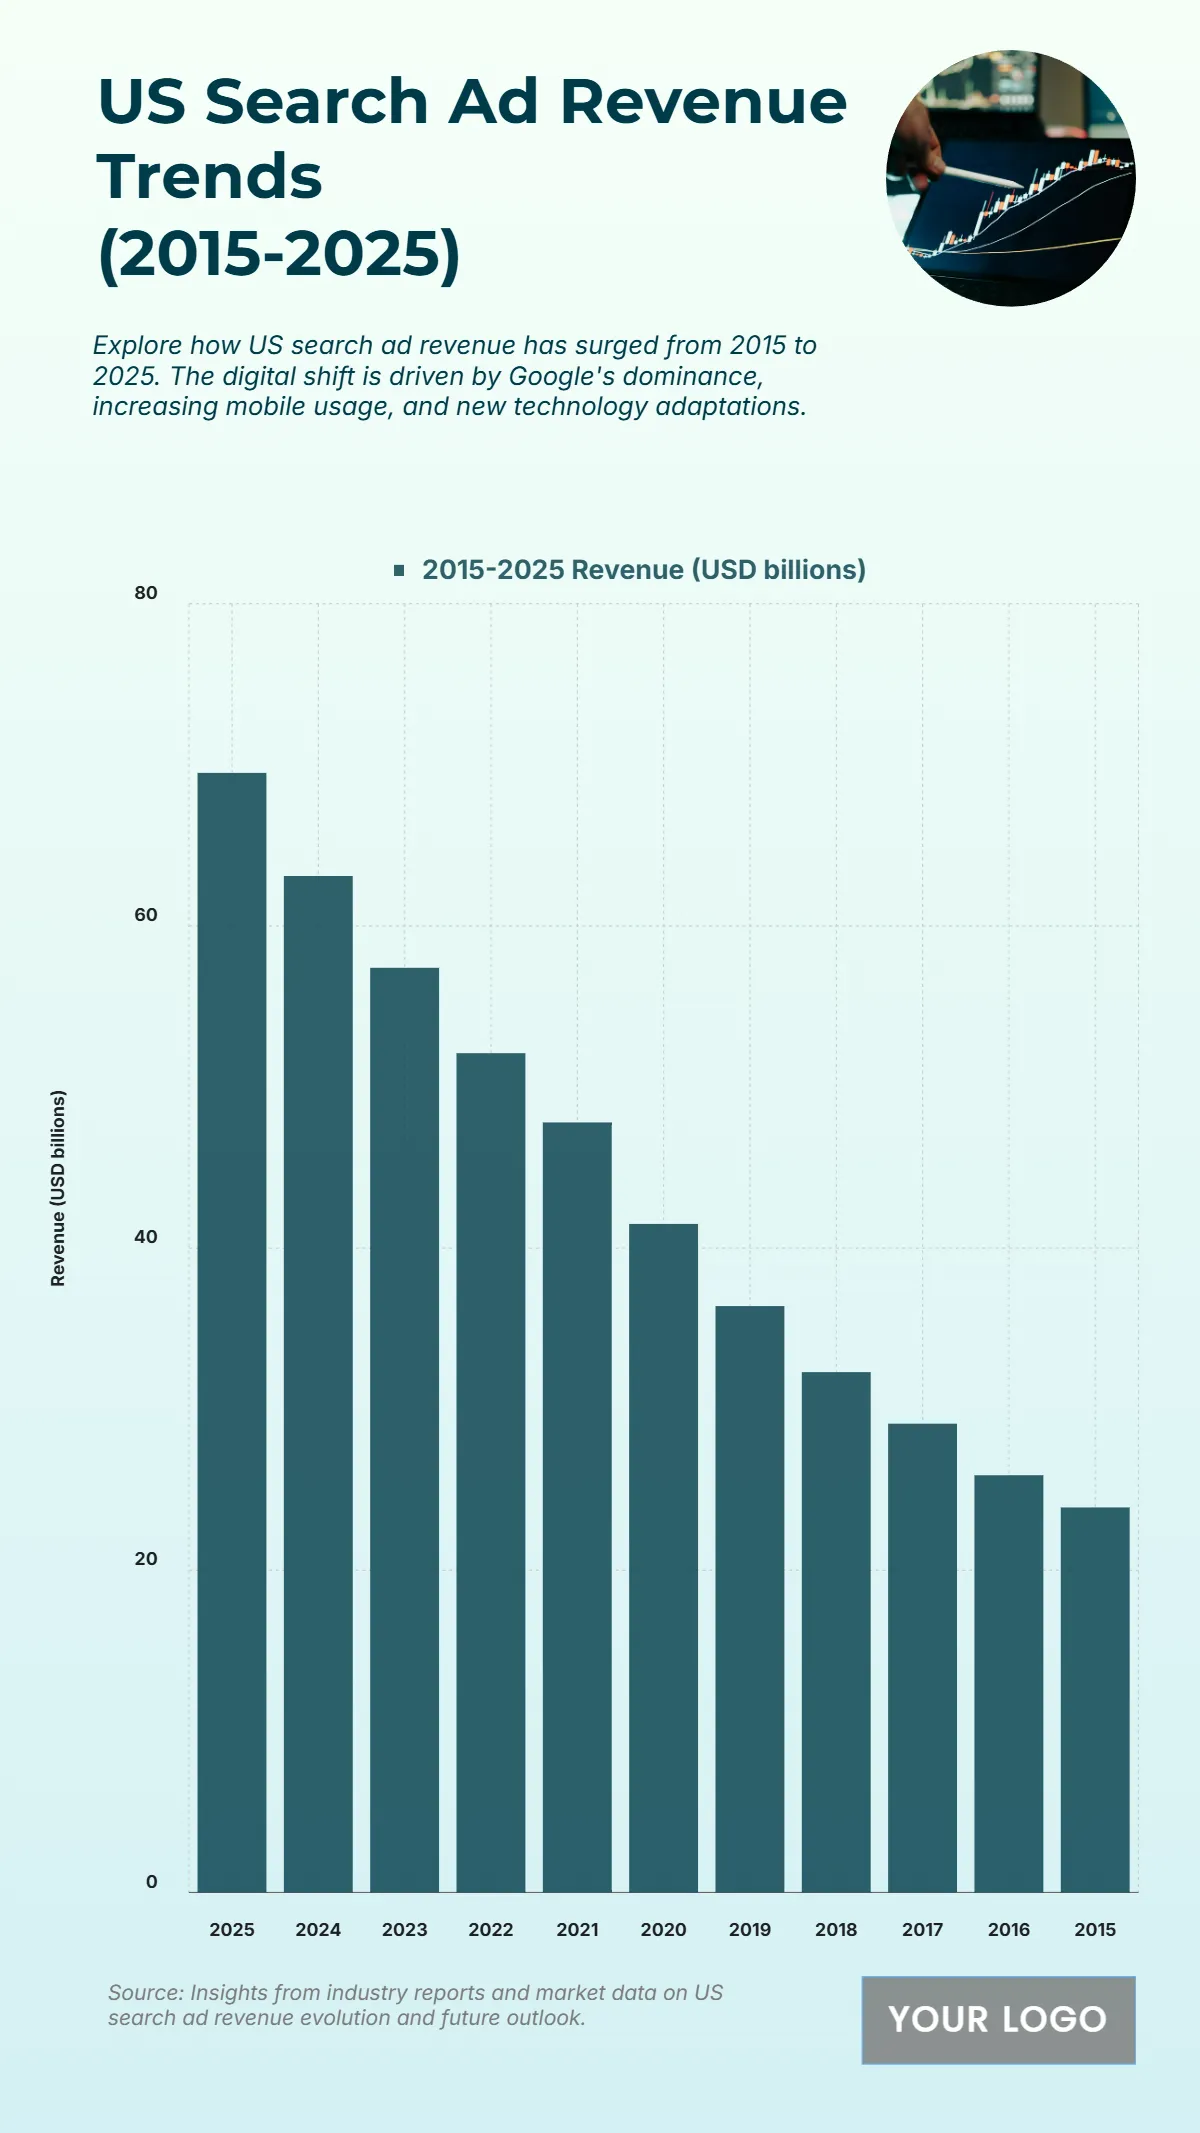
The chart shows a strong upward trend in U.S. search ad revenue from 2015 to 2025, emphasizing the growing dominance of digital search advertising. Revenue started at $23.9 billion in 2015, gradually increasing through the years as digital search became a key marketing channel. By 2020, revenue had climbed to $41.5 billion, reflecting increased mobile usage and advertiser investment. From 2021 onward, growth accelerated significantly — reaching $52.1 billion in 2022 and $63.1 billion in 2024. The peak is projected in 2025 at $69.5 billion, highlighting the sustained shift to search-based advertising strategies. This growth is largely driven by tech advancements, advertiser targeting capabilities, and the dominance of major search platforms.
| Year | 2015–2025 Revenue (USD billions) |
|---|---|
| 2025 | 69.5 |
| 2024 | 63.1 |
| 2023 | 57.4 |
| 2022 | 52.1 |
| 2021 | 47.8 |
| 2020 | 41.5 |
| 2019 | 36.4 |
| 2018 | 32.3 |
| 2017 | 29.1 |
| 2016 | 25.9 |
| 2015 | 23.9 |


