Free US Video Advertising Market Share by Platform from 2020 to 2025 Chart
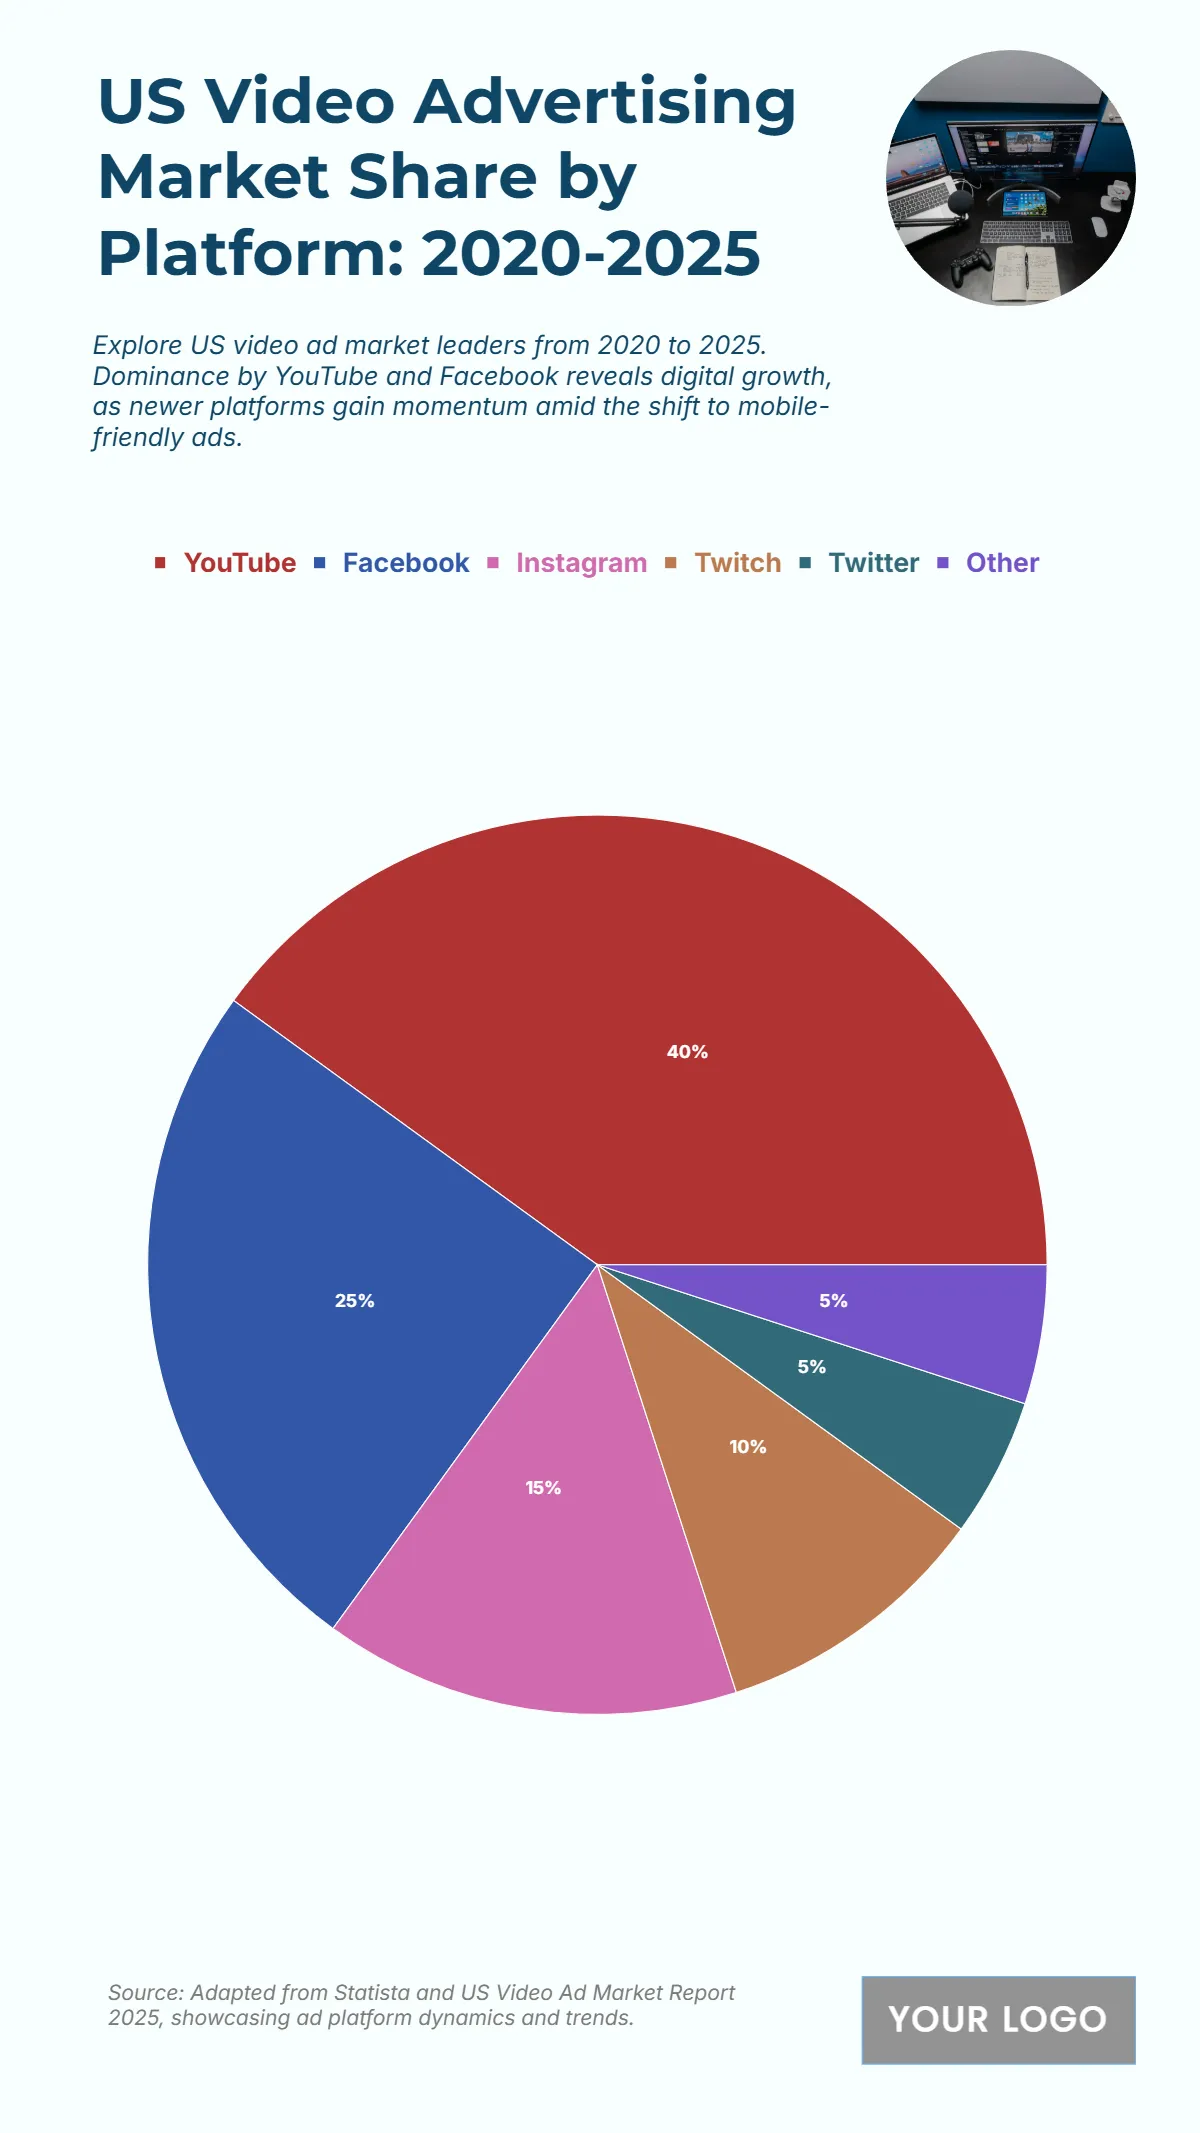
The chart illustrates the U.S. video advertising market share by platform from 2020 to 2025, showcasing how major players dominate the landscape. ** leads with 40%, maintaining its position as the primary platform for video ads due to its massive audience and diverse content ecosystem. ** follows with 25%, reflecting strong engagement through in-feed and story-based video formats. ** captures 15%**, benefiting from its visual appeal and integration with influencer marketing. **** and **** hold 10% and 5%, respectively, serving niche yet loyal audiences — Twitch in live streaming and Twitter in short-form content. The remaining 5% is shared among other emerging platforms. Overall, the data emphasizes the dominance of social-video platforms and advertisers’ growing focus on mobile-friendly, visual storytelling formats.
| Labels | 2020–2025 Market Share (%) |
|---|---|
| YouTube | 40 |
| 25 | |
| 15 | |
| Twitch | 10 |
| 5 | |
| Other | 5 |


