Free US Advertising Budget Allocation Across Media Channels from 2015 to 2025 Chart
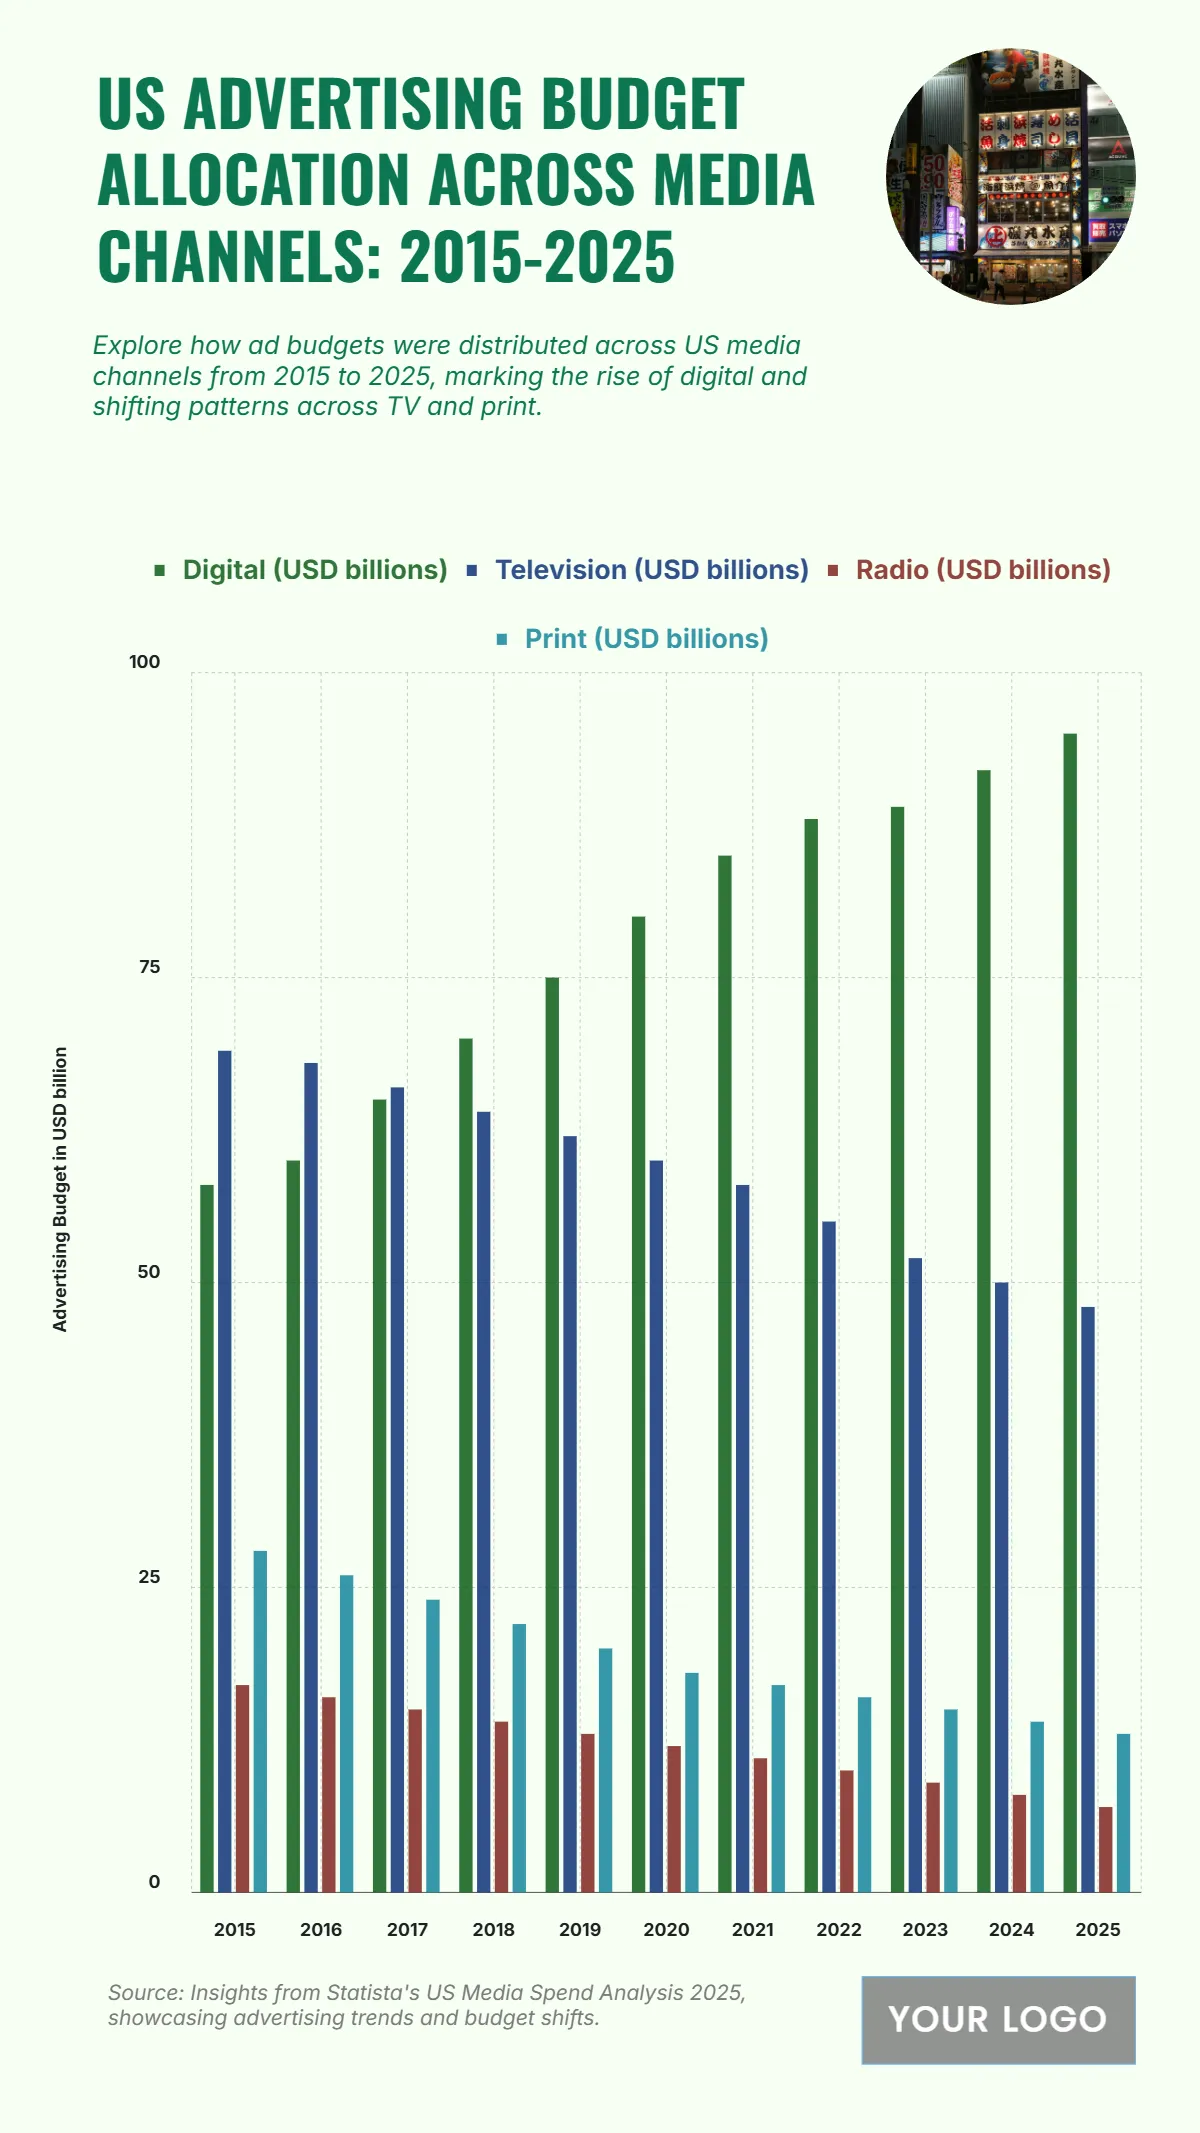
The chart shows a major shift in U.S. advertising budget allocation across media channels from 2015 to 2025, highlighting the rapid rise of digital media and the gradual decline of traditional channels. In 2015, digital ad spend was $58 billion, trailing behind television at $69 billion, but over the years, digital steadily surpassed other formats. By 2020, digital ad spend had grown to $80 billion, while TV dropped to $60 billion. This trend continues sharply, reaching $95 billion in 2025 for digital, while TV falls to $48 billion, reflecting advertisers’ move toward online platforms.
Radio and print show a consistent decline: radio drops from $17 billion in 2015 to $7 billion in 2025, and print decreases from $28 billion to $13 billion in the same period. This digital-first transformation underscores the shift toward mobile, search, and programmatic advertising, as brands invest more in measurable and high-ROI channels.
| Year | Digital (USD billions) | Television (USD billions) | Radio (USD billions) | Print (USD billions) |
|---|---|---|---|---|
| 2015 | 58 | 69 | 17 | 28 |
| 2016 | 60 | 68 | 16 | 26 |
| 2017 | 65 | 66 | 15 | 24 |
| 2018 | 70 | 64 | 14 | 22 |
| 2019 | 75 | 62 | 13 | 20 |
| 2020 | 80 | 60 | 12 | 18 |
| 2021 | 85 | 58 | 11 | 17 |
| 2022 | 88 | 55 | 10 | 16 |
| 2023 | 89 | 52 | 9 | 15 |
| 2024 | 92 | 50 | 8 | 14 |
| 2025 | 95 | 48 | 7 | 13 |


