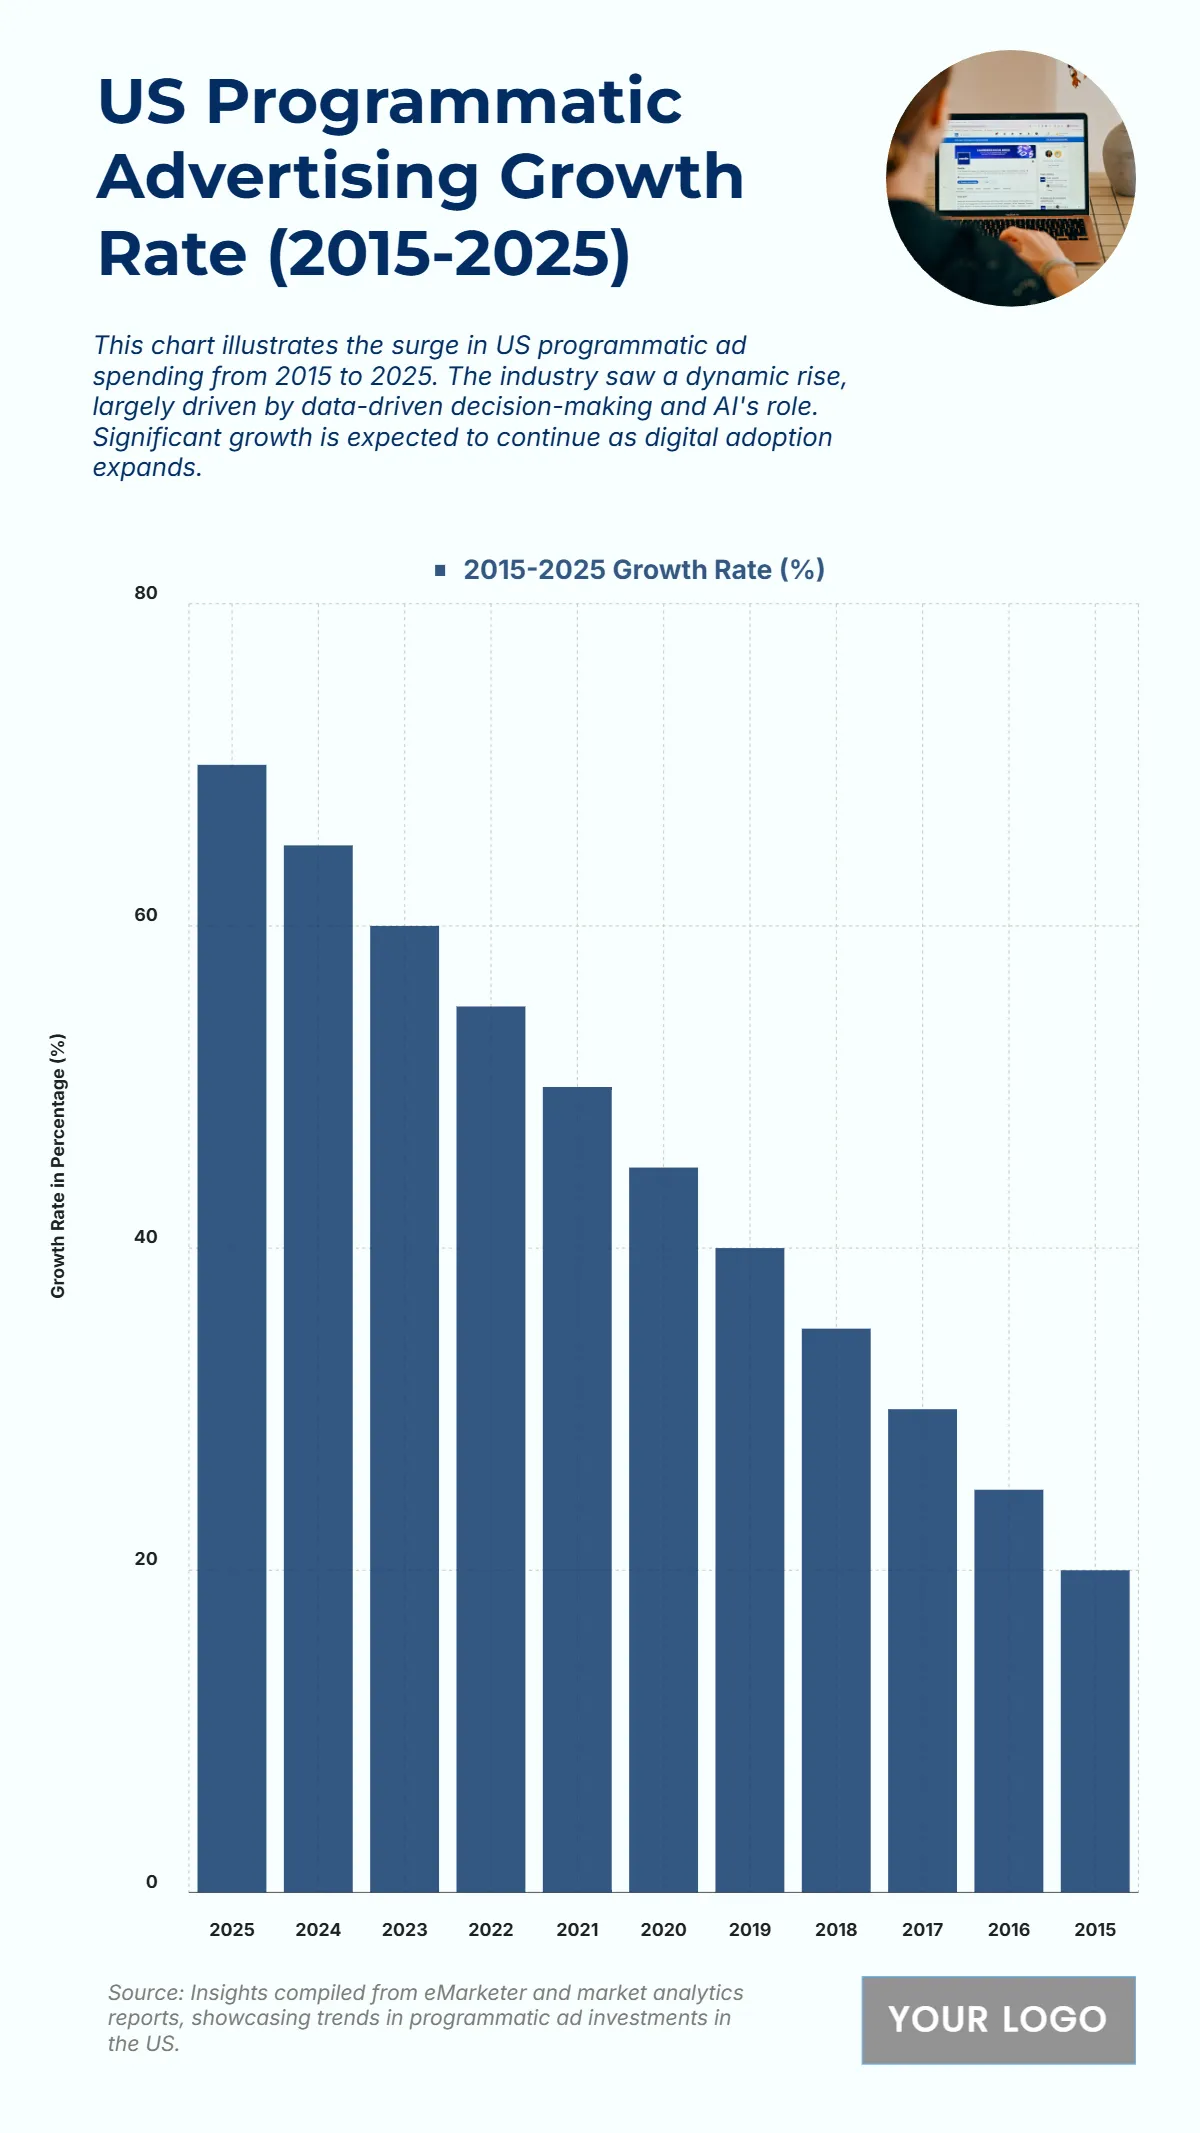
Free US Programmatic Advertising Growth Rate from 2015 to 2025 Chart
The chart illustrates how US ad budgets have shifted across media channels from 2015 to 2025, emphasizing the dominance of digital platforms and the decline of traditional media. Digital advertising grew rapidly from $58 billion in 2015 to $95 billion in 2025, showing its position as the primary focus for marketers. Television spending steadily decreased from $69 billion to $48 billion, reflecting reduced reliance on broadcast ads. Meanwhile, radio dropped from $17 billion to $7 billion, and print media fell sharply from $28 billion to $13 billion. This decade-long trend highlights a clear transition toward online and data-driven advertising, as brands prioritize measurable engagement and mobile-focused campaigns.
| Year | Digital (USD billions) | Television (USD billions) | Radio (USD billions) | Print (USD billions) |
|---|---|---|---|---|
| 2015 | 58 | 69 | 17 | 28 |
| 2016 | 60 | 68 | 16 | 26 |
| 2017 | 65 | 66 | 15 | 24 |
| 2018 | 70 | 64 | 14 | 22 |
| 2019 | 75 | 62 | 13 | 20 |
| 2020 | 80 | 60 | 12 | 18 |
| 2021 | 85 | 58 | 11 | 17 |
| 2022 | 88 | 55 | 10 | 16 |
| 2023 | 89 | 52 | 9 | 15 |
| 2024 | 92 | 50 | 8 | 14 |
| 2025 | 95 | 48 | 7 | 13 |


