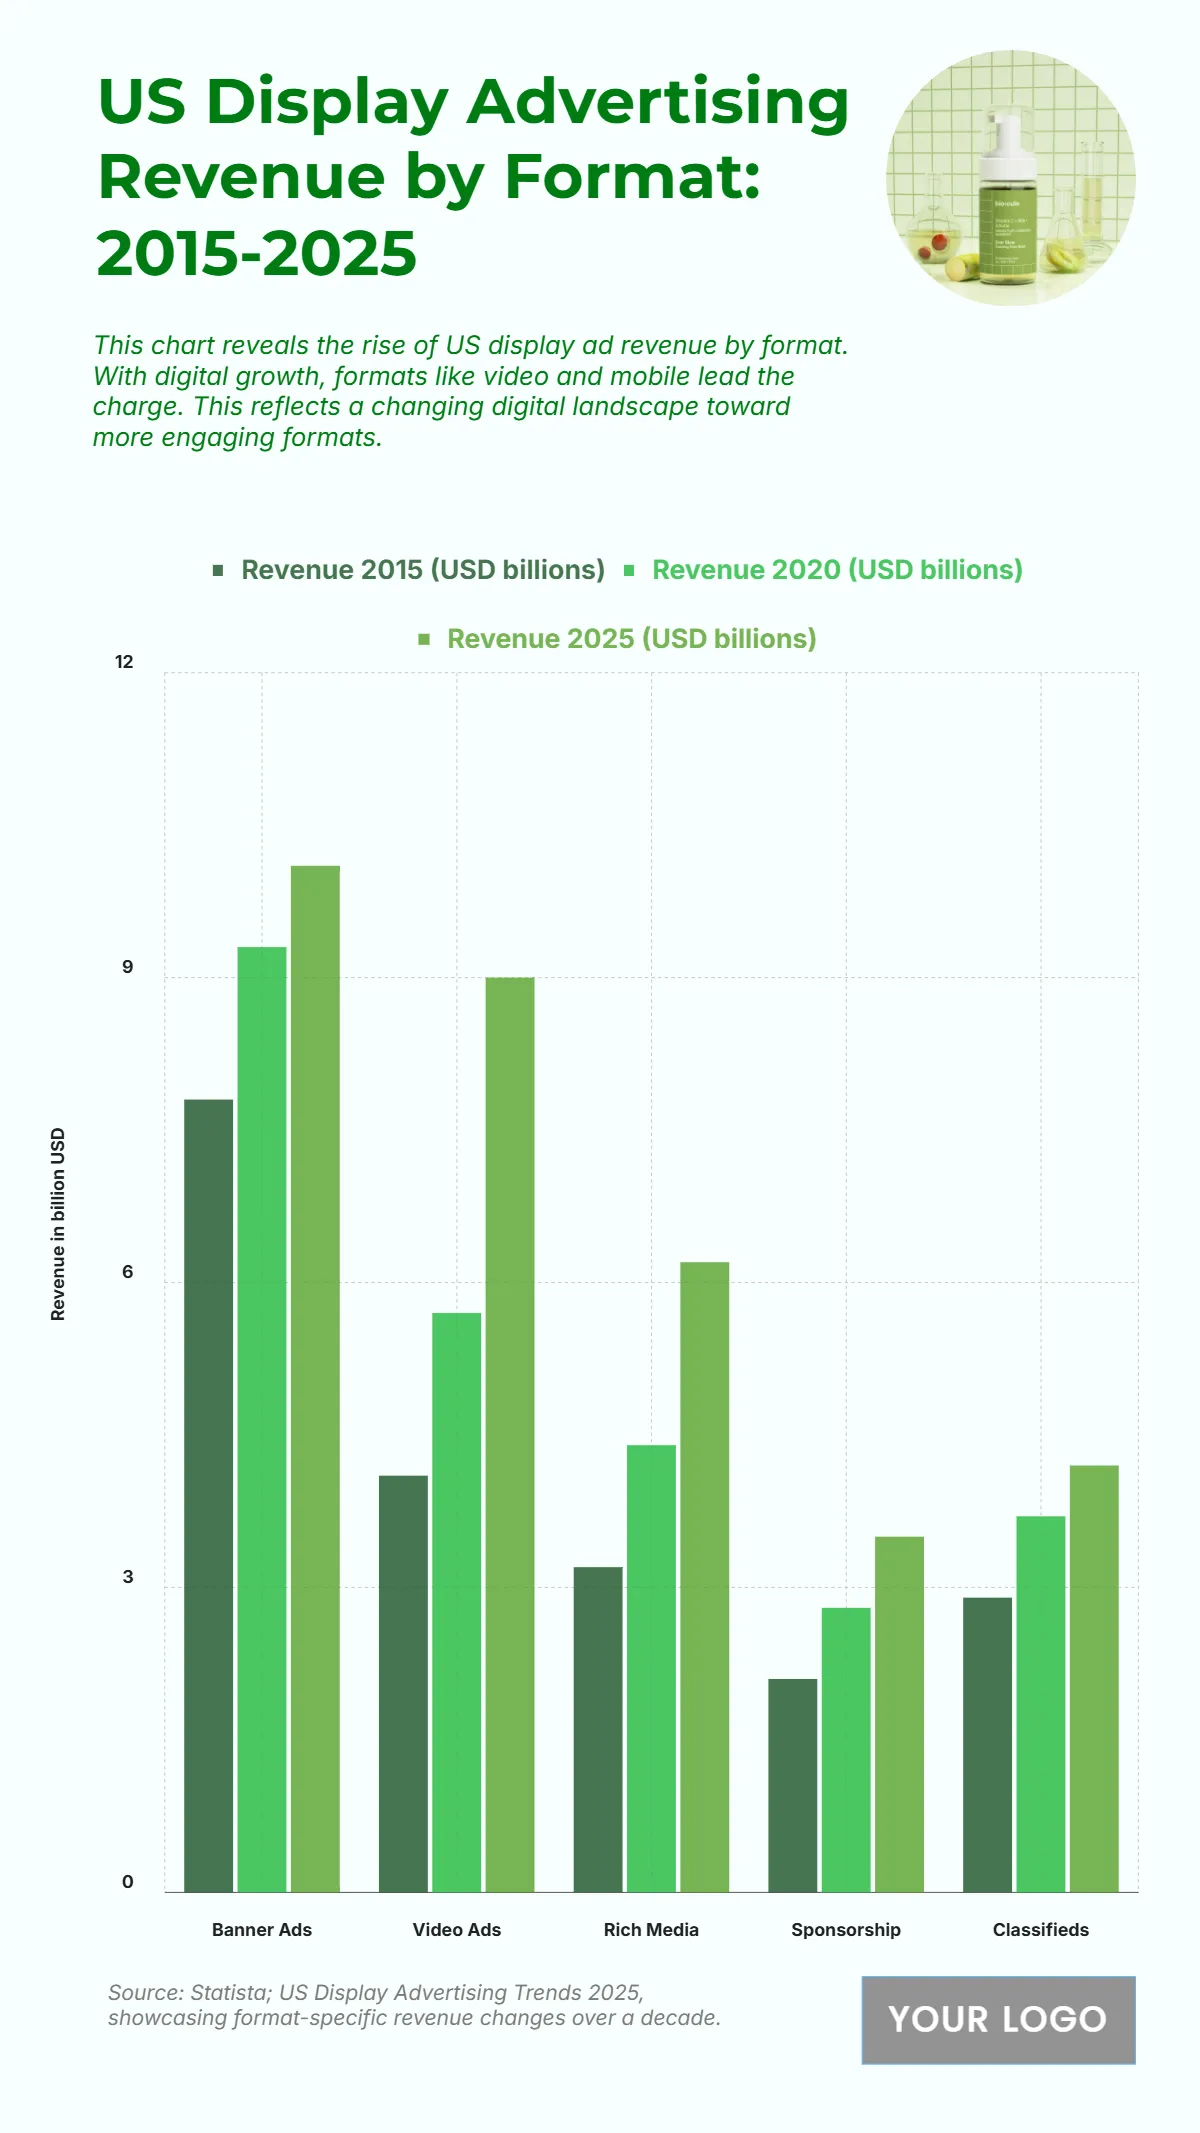
Free US Display Advertising Revenue by Format from 2015 to 2025 Chart
The chart highlights the evolution of U.S. display advertising revenue by format from 2015 to 2025, showcasing steady growth across all categories, particularly in video and rich media formats. Banner ads remain the largest contributor, increasing from $7.8 billion in 2015 to $10.1 billion in 2025, indicating their continued relevance for broad reach campaigns. Video ads experience the fastest growth, more than doubling from $4.1 billion to $9 billion, reflecting the industry's shift toward immersive and high-engagement content.
Rich media grows from $3.2 billion to $6.2 billion, boosted by interactive and dynamic ad experiences. Meanwhile, sponsorships and classifieds also see moderate increases — from $2.1B to $3.5B and $2.9B to $4.2B, respectively — showing sustained demand for niche and targeted advertising opportunities. Overall, these trends highlight a clear pivot toward visually engaging, interactive ad formats that capture consumer attention more effectively in the digital age.
| Labels | 2015 Revenue (USD billions) | 2020 Revenue (USD billions) | 2025 Revenue (USD billions) |
|---|---|---|---|
| Banner Ads | 7.8 | 9.3 | 10.1 |
| Video Ads | 4.1 | 5.7 | 9.0 |
| Rich Media | 3.2 | 4.4 | 6.2 |
| Sponsorship | 2.1 | 2.8 | 3.5 |
| Classifieds | 2.9 | 3.7 | 4.2 |


