Free US Influencer Marketing Spend by Industry from 2020 to 2025 Chart
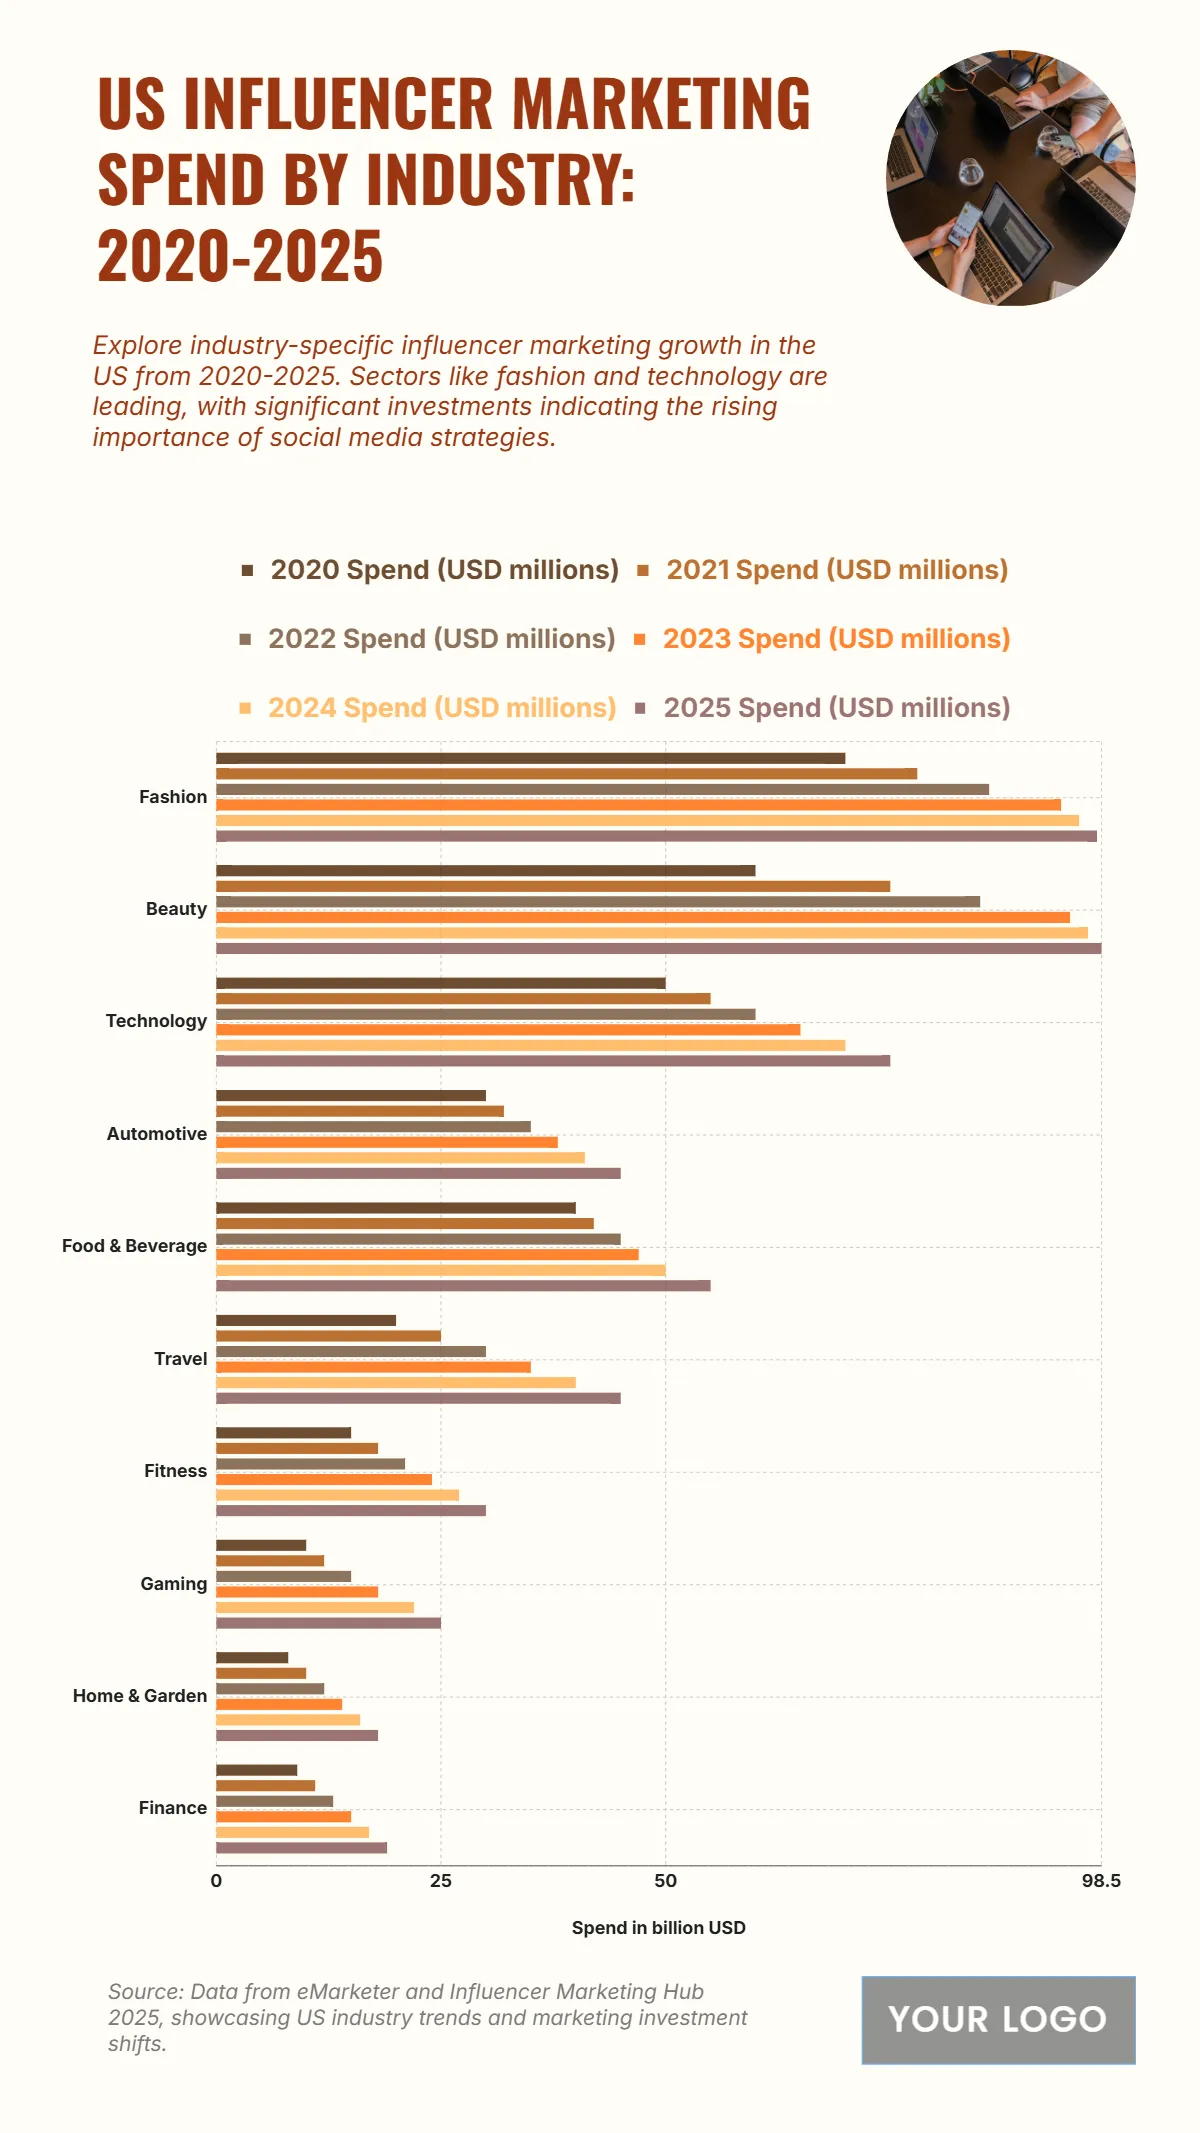
The chart highlights the steady growth of U.S. influencer marketing spend by industry from 2020 to 2025, showcasing how brands are increasingly investing in social media partnerships. Fashion and Beauty dominate the market, with expenditures rising from $70M and $60M in 2020 to $98M and $98.5M in 2025, respectively — a reflection of their strong presence in visual and influencer-driven platforms.
Technology follows with spending increasing from $50M to $75M, underscoring the growing use of influencers to promote gadgets, software, and tech lifestyle products. Mid-tier industries like Automotive, Food & Beverage, and Travel also show consistent growth, reaching $45M, $55M, and $45M in 2025.
Sectors like Fitness, Gaming, Home & Garden, and Finance see moderate but steady gains, signaling diversification in influencer marketing strategies beyond fashion and beauty. This trend reflects a broader adoption of influencer collaborations across industries, driven by consumer engagement on digital platforms.
| Labels | 2020 | 2021 | 2022 | 2023 | 2024 | 2025 |
|---|---|---|---|---|---|---|
| Fashion | 70 | 78 | 86 | 94 | 96 | 98 |
| Beauty | 60 | 75 | 85 | 95 | 97 | 98.5 |
| Technology | 50 | 55 | 60 | 65 | 70 | 75 |
| Automotive | 30 | 32 | 35 | 38 | 41 | 45 |
| Food & Beverage | 40 | 42 | 45 | 47 | 50 | 55 |
| Travel | 20 | 25 | 30 | 35 | 40 | 45 |
| Fitness | 15 | 18 | 21 | 24 | 27 | 30 |
| Gaming | 10 | 12 | 15 | 18 | 22 | 25 |
| Home & Garden | 8 | 10 | 12 | 14 | 16 | 18 |
| Finance | 9 | 11 | 13 | 15 | 17 | 19 |


