Free US Advertising Effectiveness by Age Demographics from 2015 to 2025 Chart
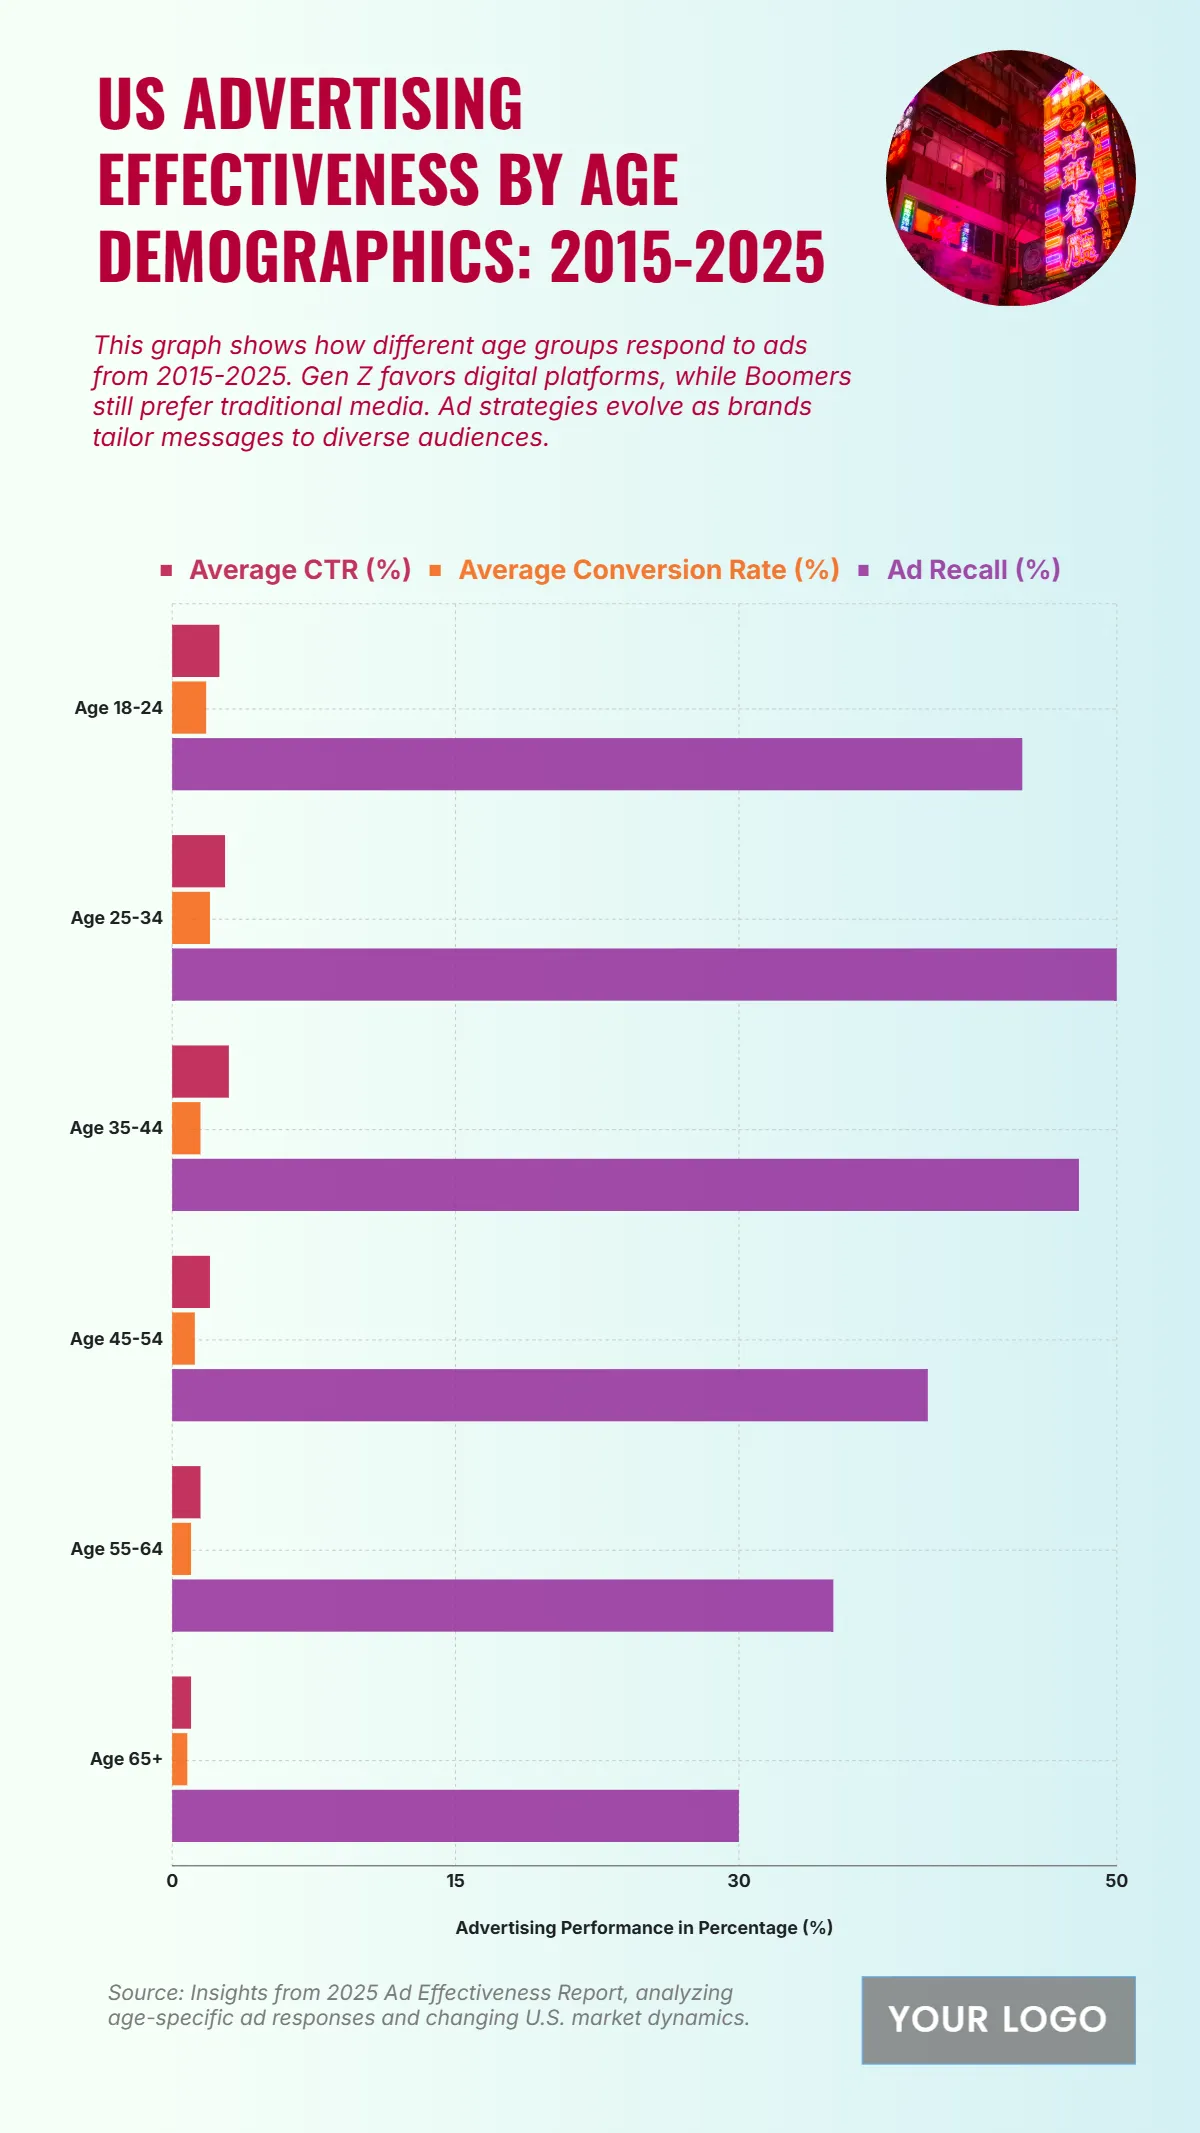
The chart illustrates U.S. advertising effectiveness by age demographics from 2015 to 2025, highlighting variations in CTR (Click-Through Rate), conversion rate, and ad recall across age groups.
The highest CTR (3%) comes from the 35–44 age group, indicating strong engagement with digital ads, followed closely by 25–34 (2.8%) and 18–24 (2.5%). Younger audiences (18–34) also show the highest ad recall, with 50% among ages 25–34, making them a prime target for awareness campaigns.
In terms of conversion rates, 25–34 leads with 2%, showing they are both highly engaged and more likely to complete desired actions. Engagement gradually declines with older demographics: 55–64 have a CTR of 1.5%, and 65+ drop to just 1% CTR and 0.8% conversion rate. Ad recall also decreases steadily from 45% in young adults to 30% in seniors.
These insights emphasize that younger and middle-aged audiences are the most responsive to digital ads, while older segments may require different strategies to boost effectiveness.
| Age Group | Average CTR (%) | Conversion Rate (%) | Ad Recall (%) |
|---|---|---|---|
| 18–24 | 2.5 | 1.8 | 45 |
| 25–34 | 2.8 | 2.0 | 50 |
| 35–44 | 3.0 | 1.5 | 48 |
| 45–54 | 2.0 | 1.2 | 40 |
| 55–64 | 1.5 | 1.0 | 35 |
| 65+ | 1.0 | 0.8 | 30 |


