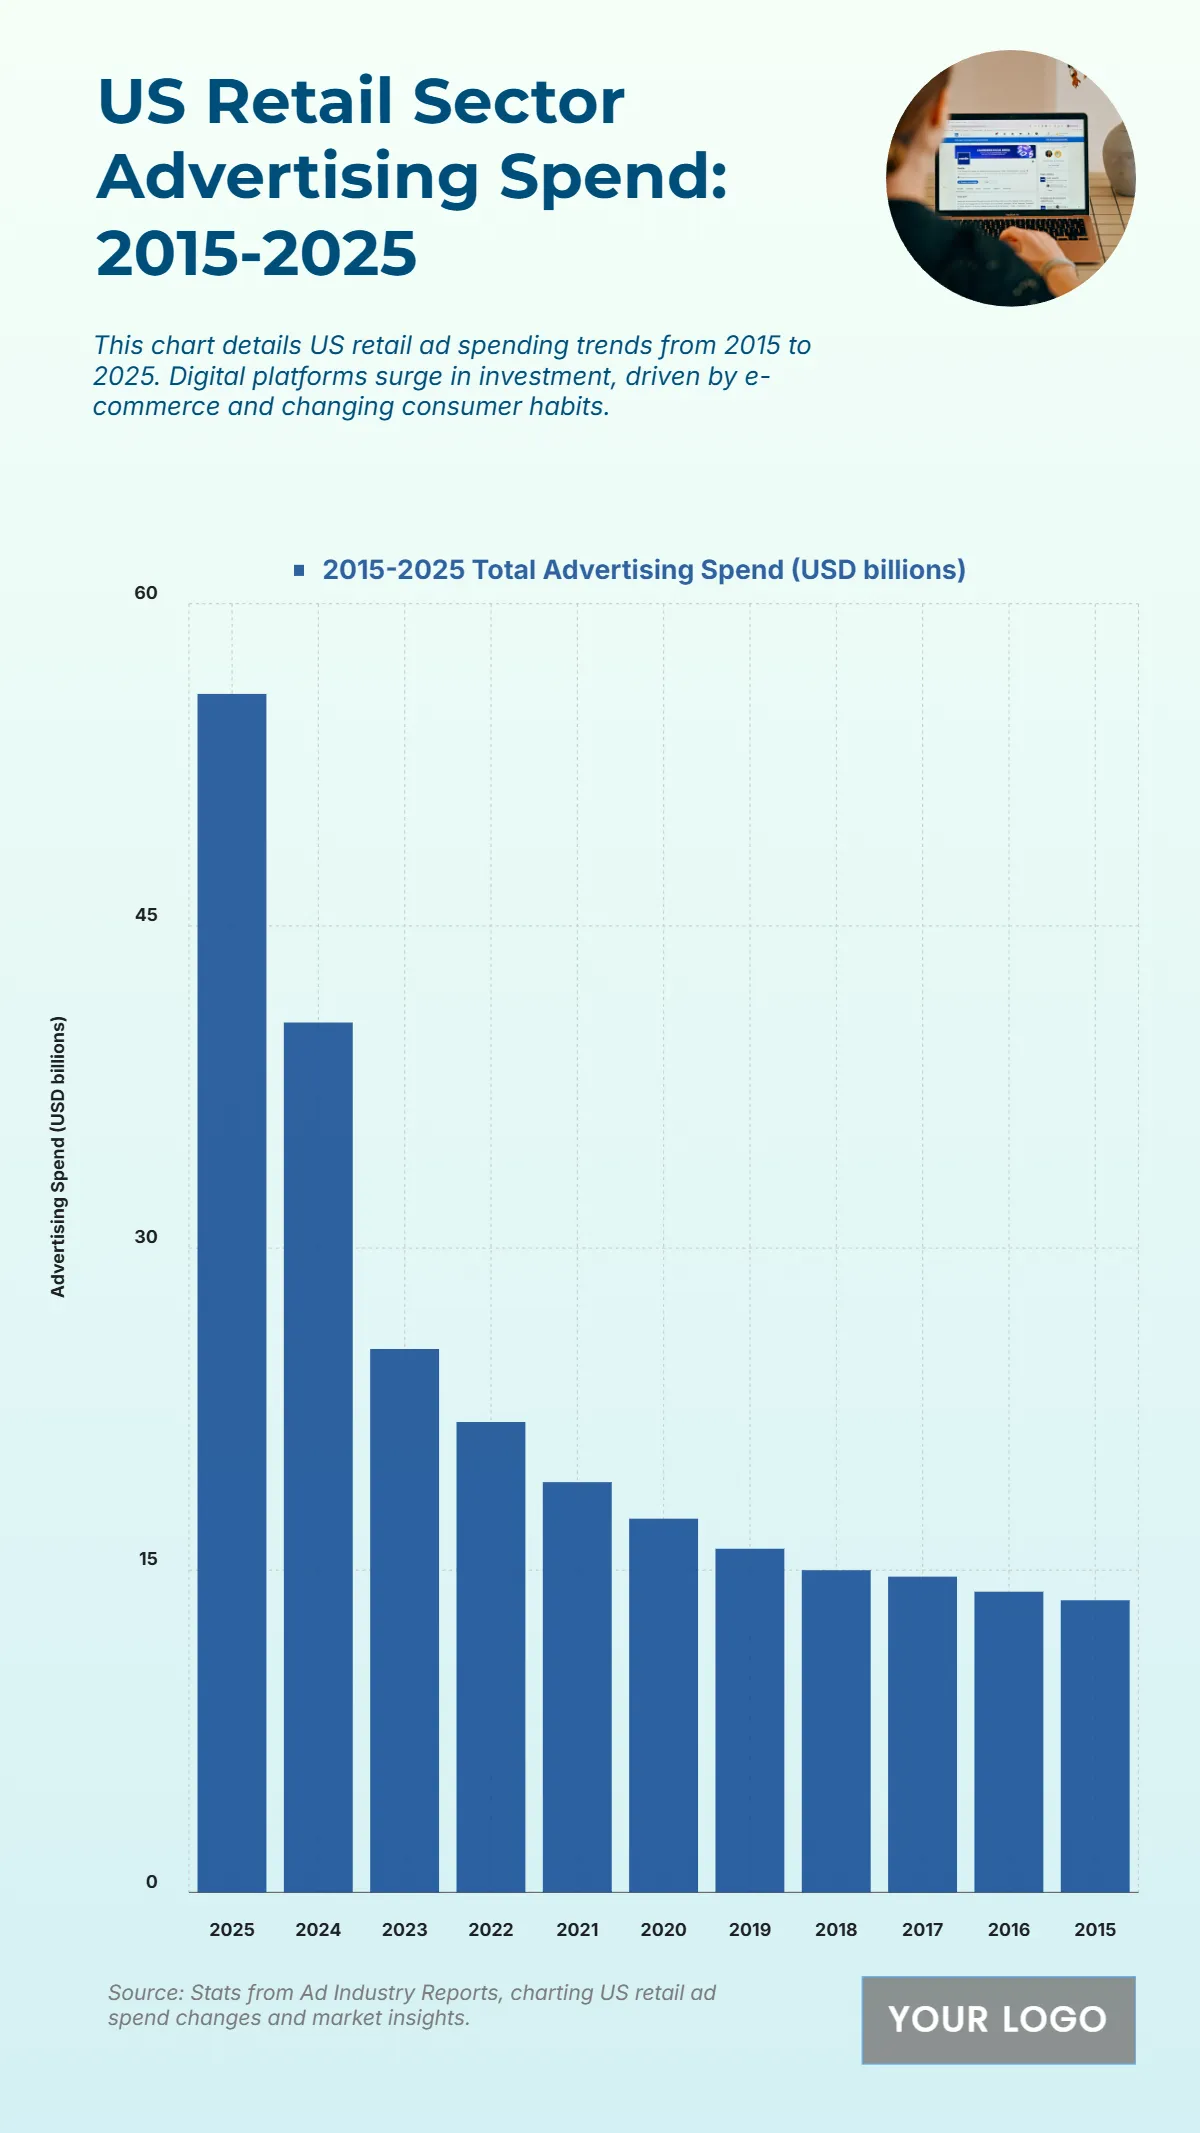
Free US Retail Sector Advertising Spend from 2015 to 2025 Chart
The chart illustrates a significant upward trend in U.S. retail advertising expenditure between 2015 and 2025, reflecting the shift towards digital commerce and evolving consumer behaviors. Spending started at $13.6 billion in 2015 and increased steadily over the years, surpassing $20 billion in 2022. A major jump occurs from $25.3 billion in 2023 to $40.5 billion in 2024, culminating at a projected $55.8 billion in 2025. This sharp rise signals intensified investment by retailers in digital marketing platforms to stay competitive in the e-commerce landscape. The most rapid acceleration is observed after 2020, where the annual spend nearly triples within five years, underlining the critical role of digital advertising strategies in retail growth. This upward momentum demonstrates not only higher ad budgets but also a transformation in how retail brands reach and engage their audiences.
| Labels | 2015-2025 Total Advertising Spend (USD billions) |
|---|---|
| 2025 | 55.8 |
| 2024 | 40.5 |
| 2023 | 25.3 |
| 2022 | 21.9 |
| 2021 | 19.1 |
| 2020 | 17.4 |
| 2019 | 16 |
| 2018 | 15 |
| 2017 | 14.7 |
| 2016 | 14 |
| 2015 | 13.6 |


