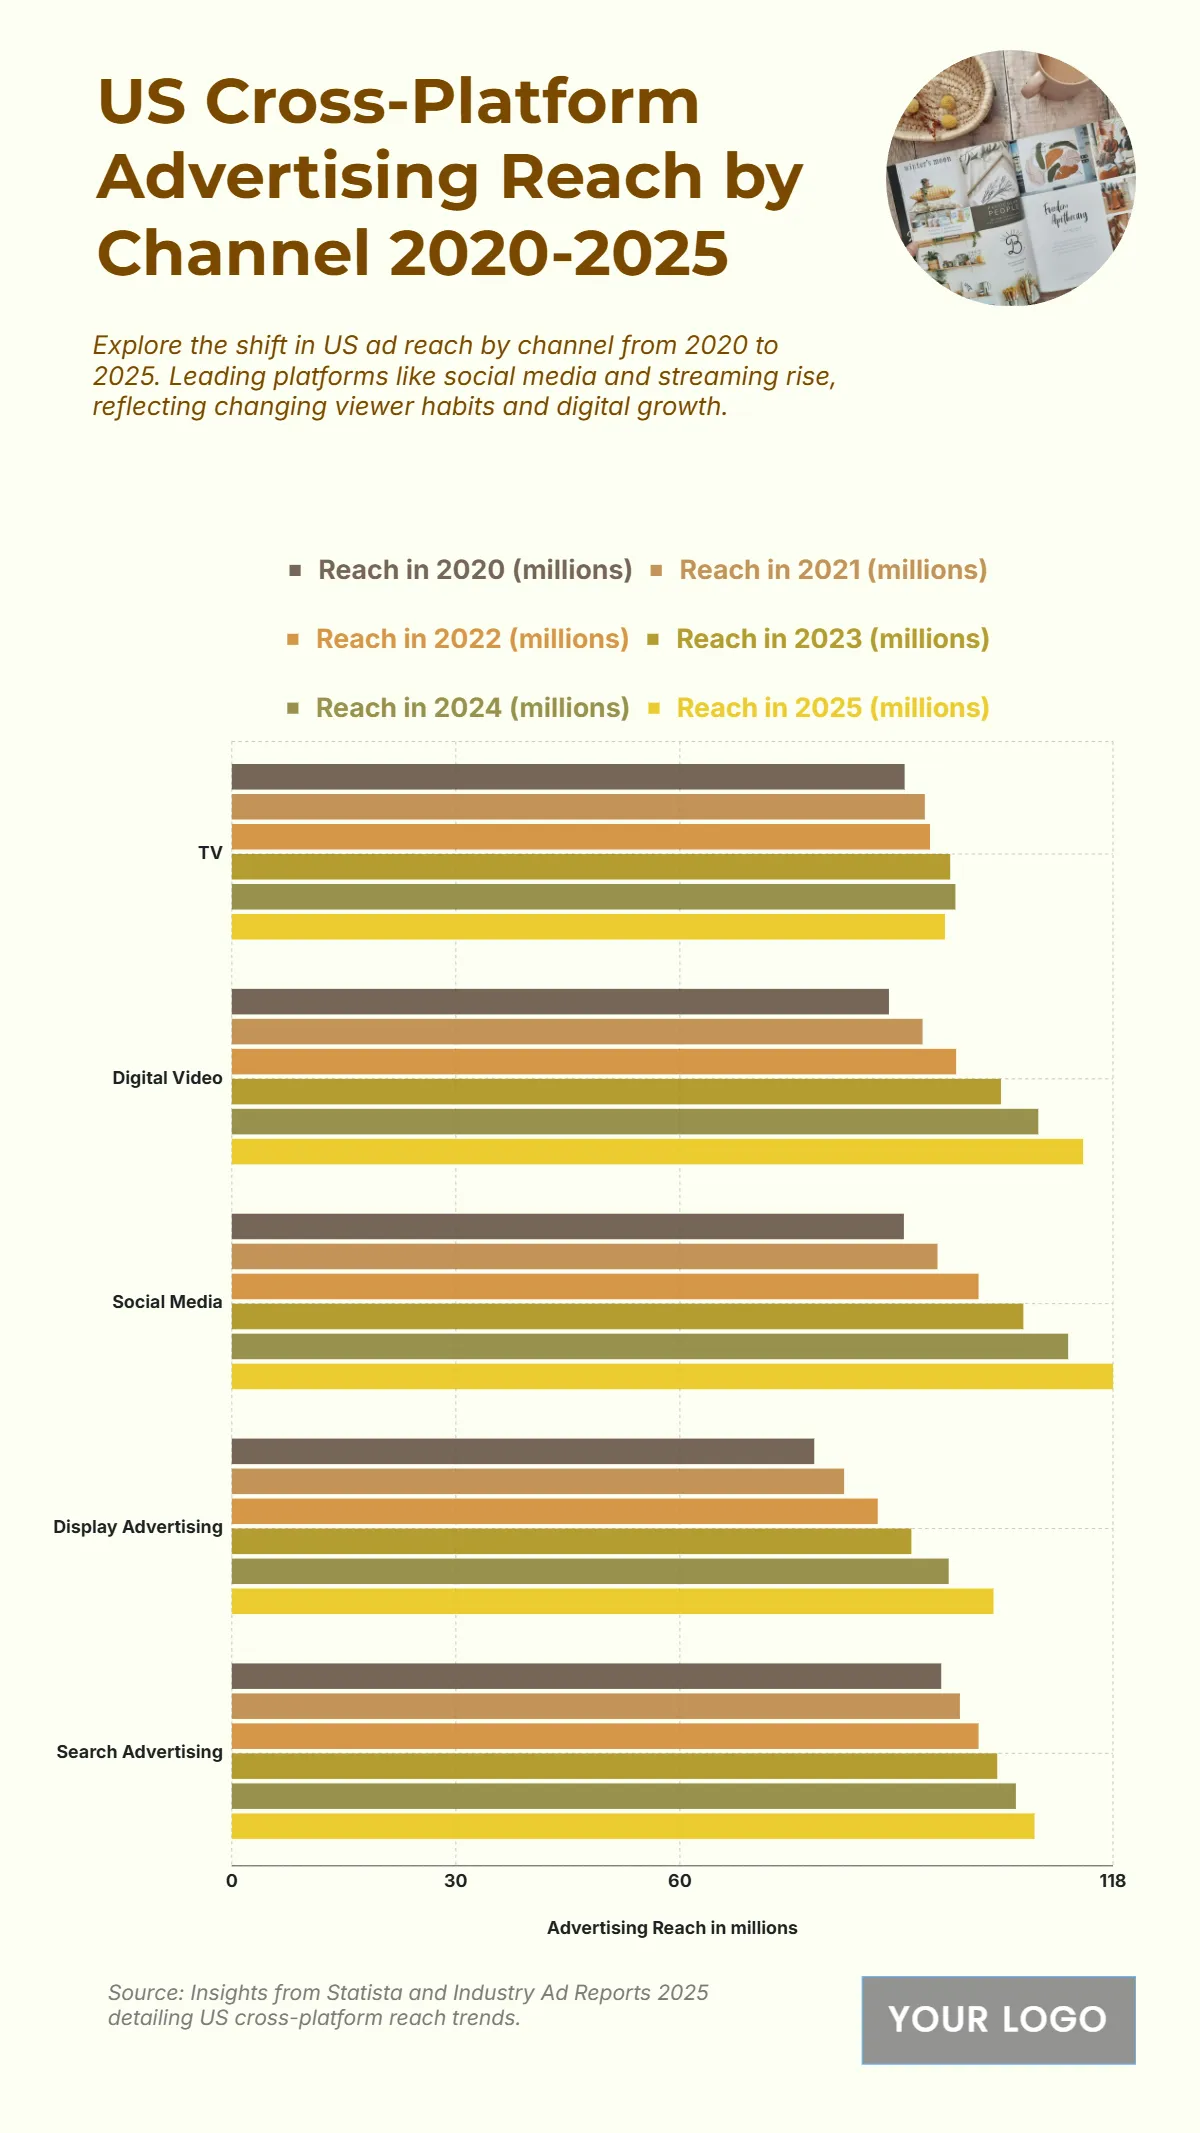
Free US Cross-Platform Advertising Reach by Channel from 2020 to 2025 Chart
The chart illustrates how U.S. cross-platform advertising reach evolved from 2020 to 2025, highlighting significant growth across digital channels while traditional TV slightly declines. TV reach decreases from 96.9 million in 2024 to 95.5 million in 2025, reflecting shifting audience behavior. In contrast, Digital Video expands from 108 million to 114 million, and Social Media grows from 112 million to 118 million, emphasizing their dominant role in capturing consumer attention. Display Advertising rises from 96 million to 102 million, and Search Advertising increases from 105 million to 107.5 million, confirming sustained advertiser investment in digital touchpoints. The widening gap between traditional and digital platforms reinforces how advertisers are strategically aligning with consumer media consumption patterns to maximize reach and engagement.
| Labels | Reach in 2024 (millions) | Reach in 2025 (millions) |
|---|---|---|
| TV | 96.9 | 95.5 |
| Digital Video | 108 | 114 |
| Social Media | 112 | 118 |
| Display Advertising | 96 | 102 |
| Search Advertising | 105 | 107.5 |


