Free US Advertising Employment Trends by Sector from 2015 to 2025 Chart
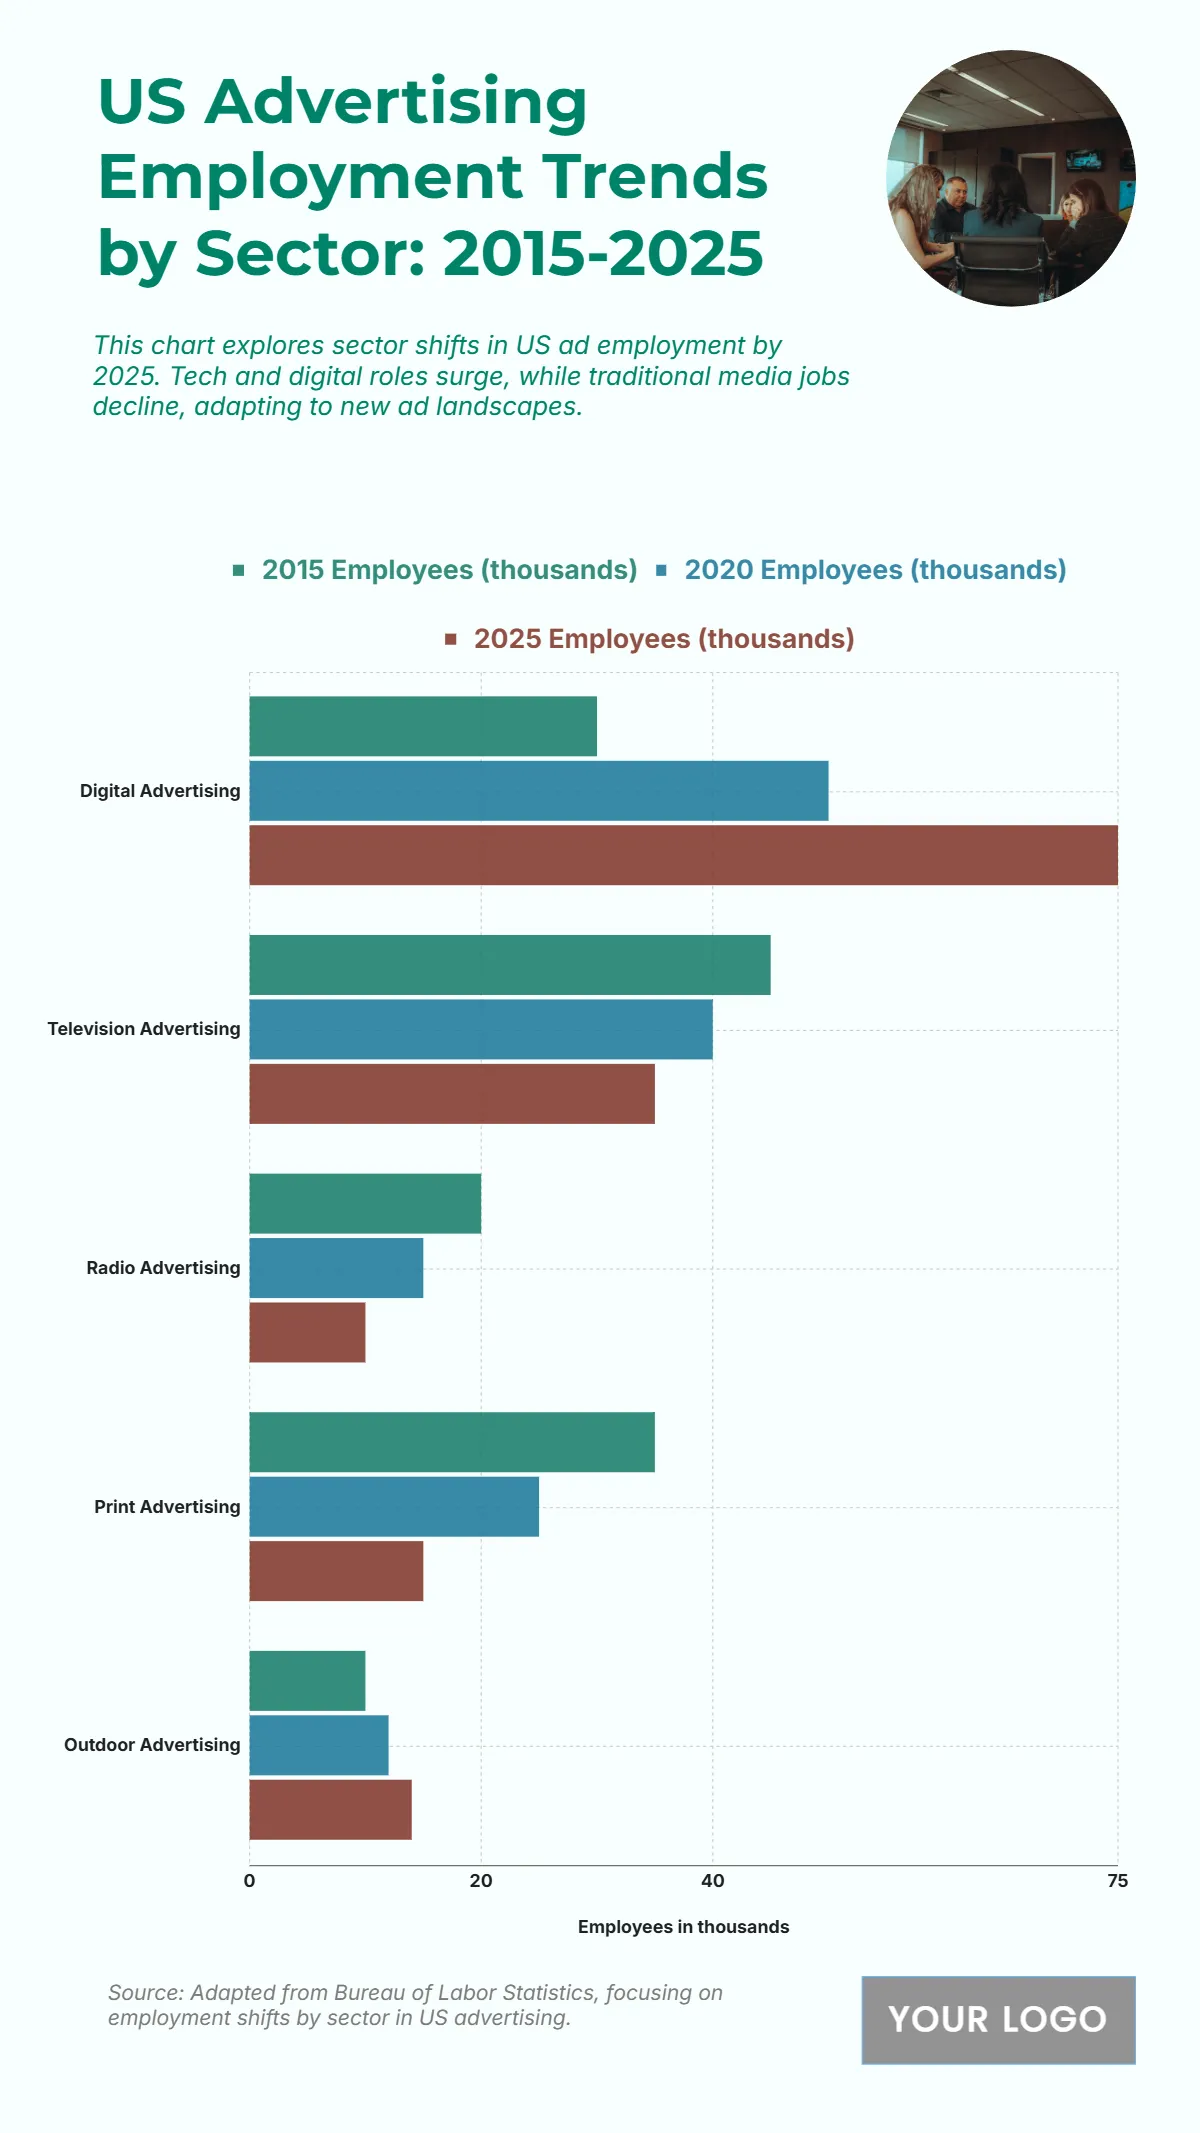
The chart depicts U.S. advertising employment shifts from 2015 to 2025, showing a strong migration toward digital sectors as traditional media roles decline. Digital advertising experiences the most significant growth, rising from 30,000 employees in 2015 to 75,000 in 2025, highlighting the expanding dominance of online platforms. In contrast, television advertising shows a steady decline from 45,000 to 35,000 employees, reflecting industry adaptation to digital streaming trends. Radio advertising employment drops from 20,000 to 10,000, while print advertising falls sharply from 35,000 to 15,000, signaling the waning influence of traditional formats. Interestingly, outdoor advertising grows slightly from 10,000 to 14,000 employees, maintaining resilience through new digital integrations like smart billboards. Overall, the data emphasizes the digital transformation of the advertising workforce, with employment shifting dramatically toward technology-driven and data-based marketing roles.
| Labels | 2015 Employees (thousands) | 2020 Employees (thousands) | 2025 Employees (thousands) |
|---|---|---|---|
| Digital Advertising | 30 | 50 | 75 |
| Television Advertising | 45 | 40 | 35 |
| Radio Advertising | 20 | 15 | 10 |
| Print Advertising | 35 | 25 | 15 |
| Outdoor Advertising | 10 | 12 | 14 |


