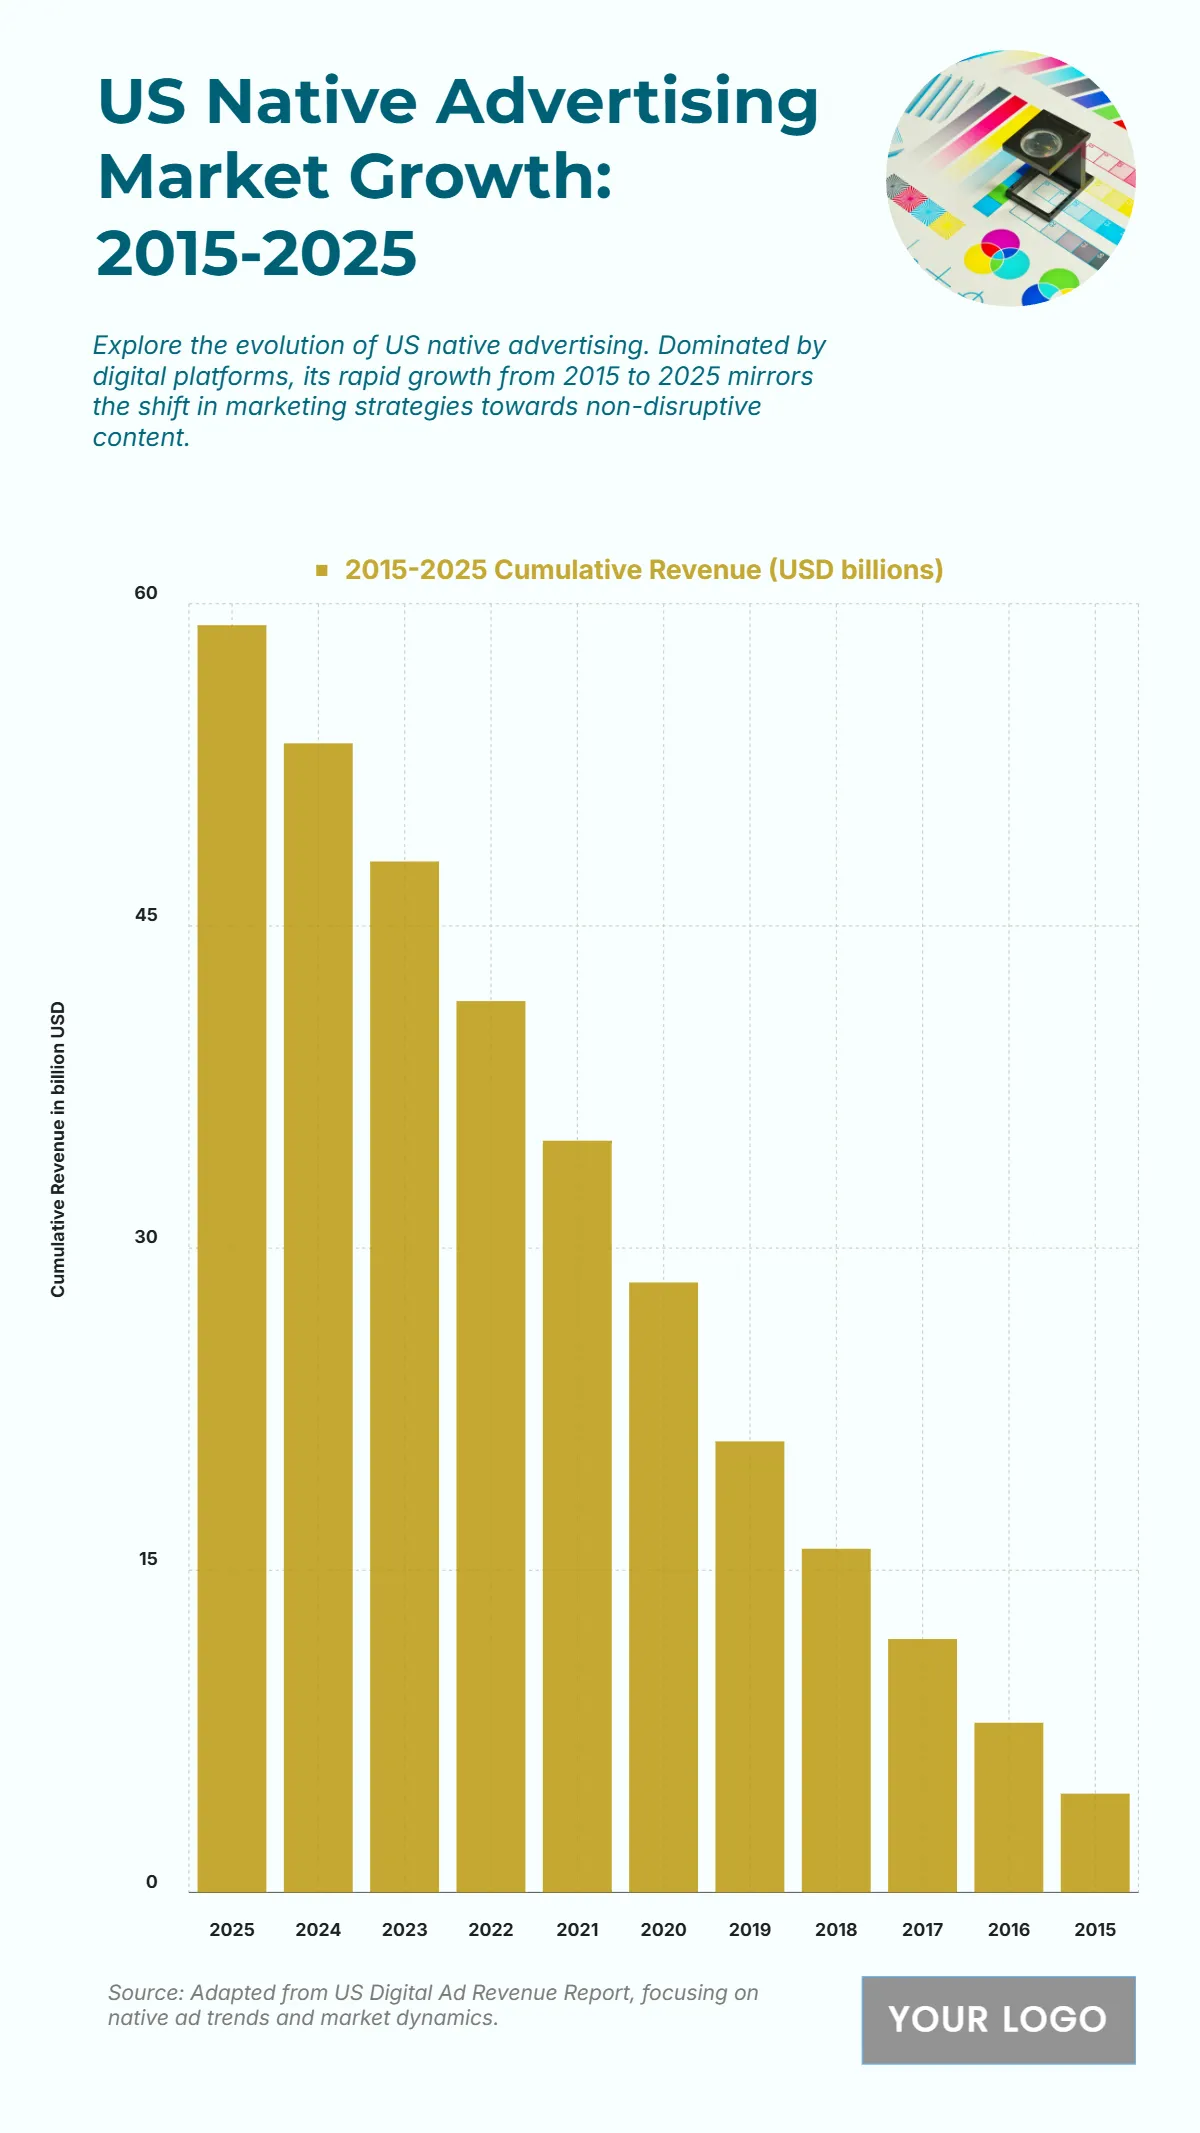
Free US Native Advertising Market Growth from 2015 to 2025 Chart
The chart highlights the steady and significant rise of U.S. native advertising market revenue from 2015 to 2025. The data shows a continuous upward trend, reflecting the increasing adoption of non-disruptive, platform-integrated advertising strategies. In 2015, the revenue started at $8 billion, followed by a climb to $12 billion in 2016, $17 billion in 2017, and $22 billion in 2018. Growth accelerated further with $28 billion in 2019, $34 billion in 2020, and $40 billion in 2021. This upward momentum continued with $45 billion in 2022, $50 billion in 2023, and $55 billion in 2024, culminating in a projected peak of $60 billion in 2025. This trajectory underscores the strength of native advertising as a dominant digital marketing channel, fueled by improved content integration, platform maturity, and changing consumer engagement behavior over the decade.
| Labels | 2015–2025 Cumulative Revenue (USD billions) |
|---|---|
| 2025 | 59 |
| 2024 | 53.5 |
| 2023 | 48 |
| 2022 | 41.5 |
| 2021 | 35 |
| 2020 | 28.4 |
| 2019 | 21 |
| 2018 | 16 |
| 2017 | 11.8 |
| 2016 | 7.9 |
| 2015 | 4.6 |


