Free US E-commerce Sector Advertising Spend from 2015 to 2025 Chart
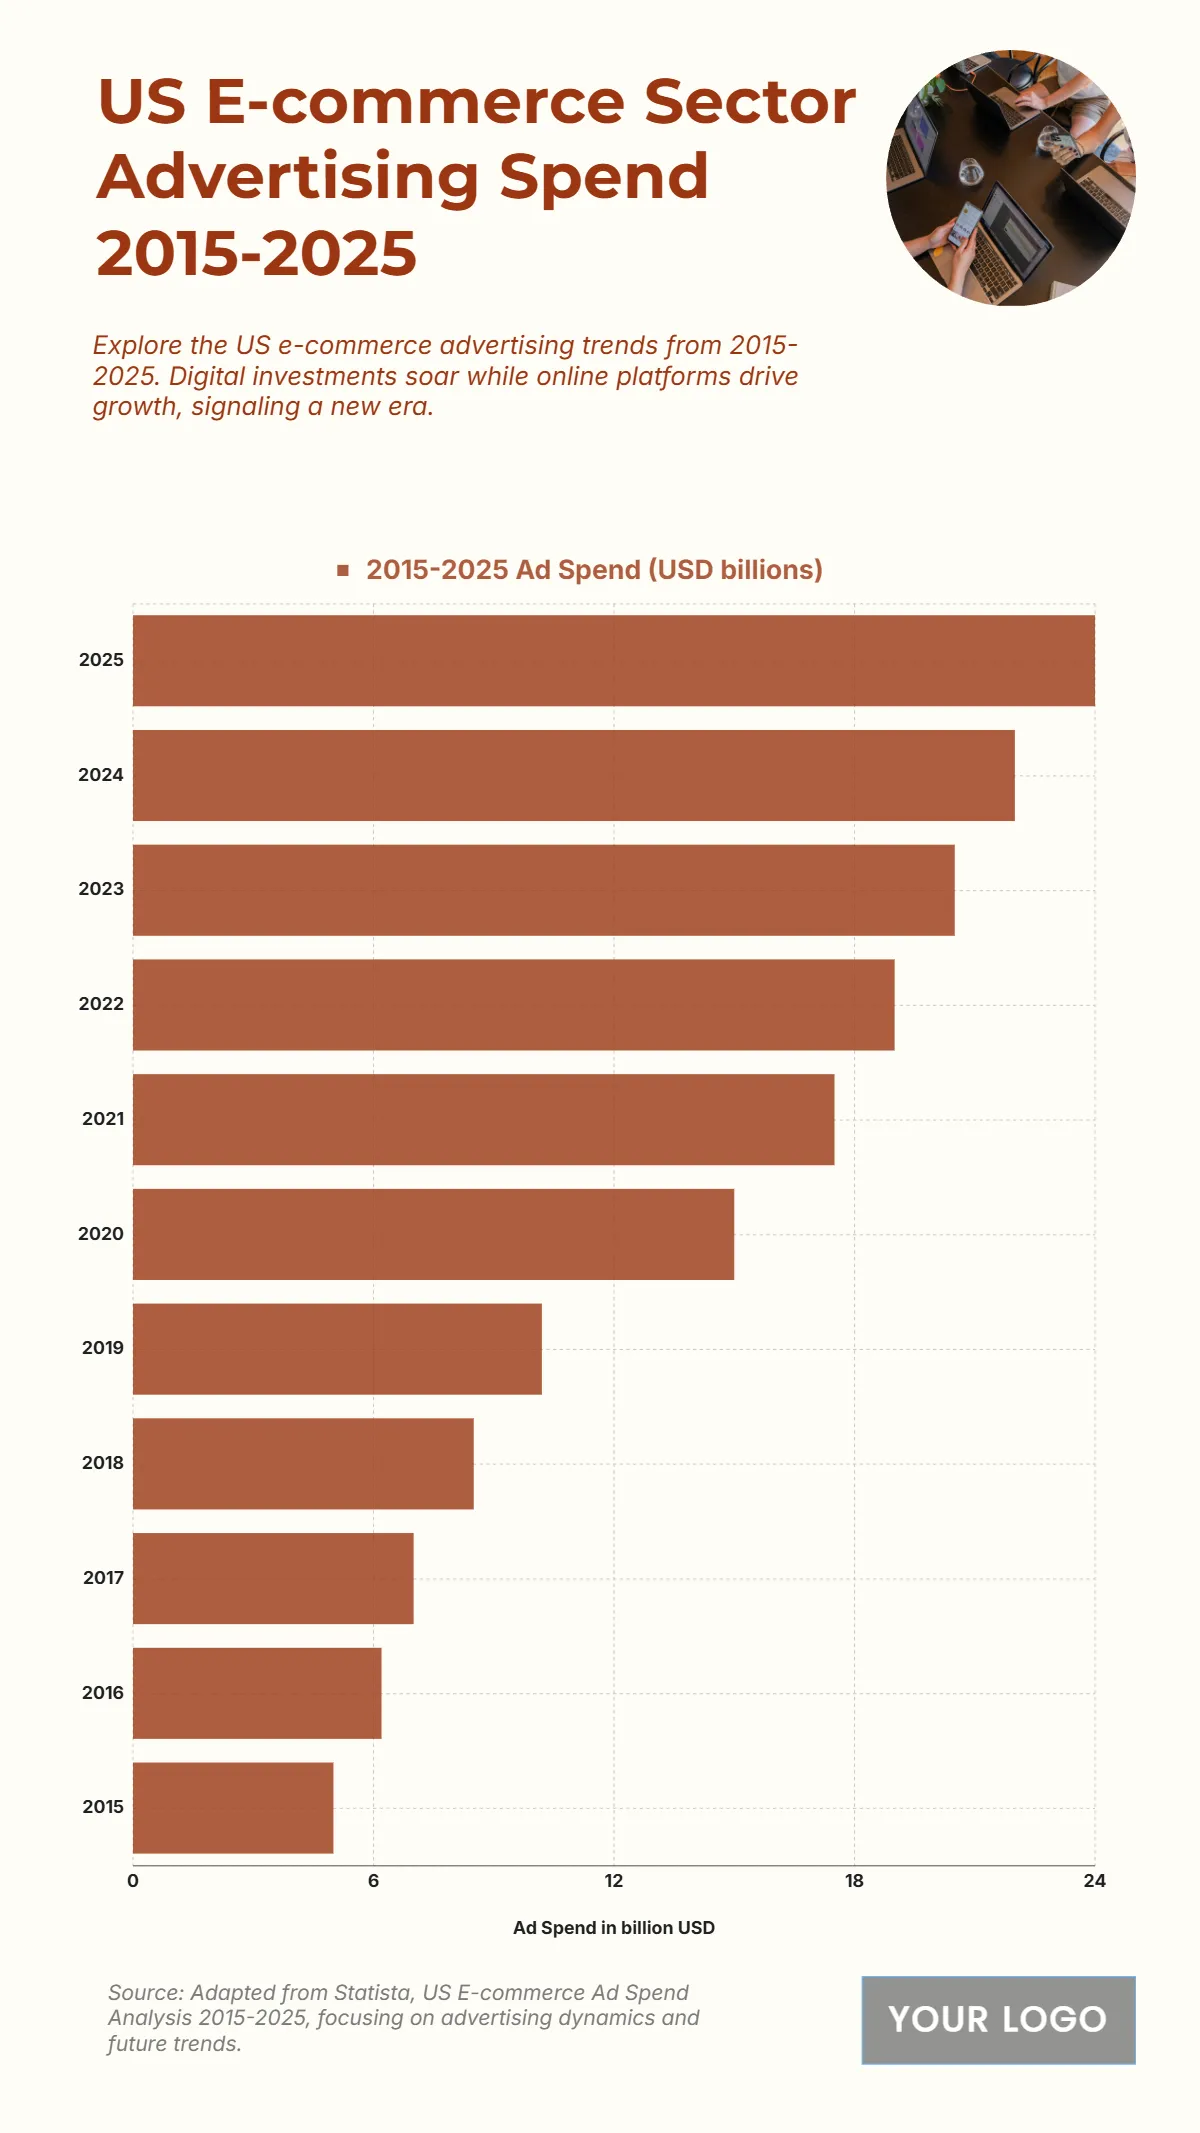
The chart shows a steady and substantial rise in U.S. e-commerce advertising spend from 2015 to 2025, underscoring the sector’s rapid digital transformation. Spending begins at USD 5.2 billion in 2015 and shows consistent yearly growth as online retail expands and digital platforms strengthen their role in marketing. By 2020, the figure increases to USD 13.8 billion, reflecting the sector’s resilience and evolving consumer behavior. The momentum accelerates further, with USD 17.2 billion in 2021 and USD 19.5 billion in 2022, indicating brands’ growing reliance on targeted e-commerce campaigns. In 2023, spending reaches USD 21 billion, followed by USD 22.6 billion in 2024, marking strong digital investment. The peak is achieved in 2025 at USD 23.8 billion, highlighting a decade-long surge in e-commerce ad spending. This upward trend emphasizes how businesses have increasingly shifted budgets toward online advertising, capitalizing on consumer engagement and digital purchasing power.
| Labels | 2015–2025 Ad Spend (USD billions) |
|---|---|
| 2025 | 24 |
| 2024 | 22 |
| 2023 | 20.5 |
| 2022 | 19 |
| 2021 | 17.5 |
| 2020 | 15 |
| 2019 | 10.2 |
| 2018 | 8.5 |
| 2017 | 7 |
| 2016 | 6.2 |
| 2015 | 5 |


