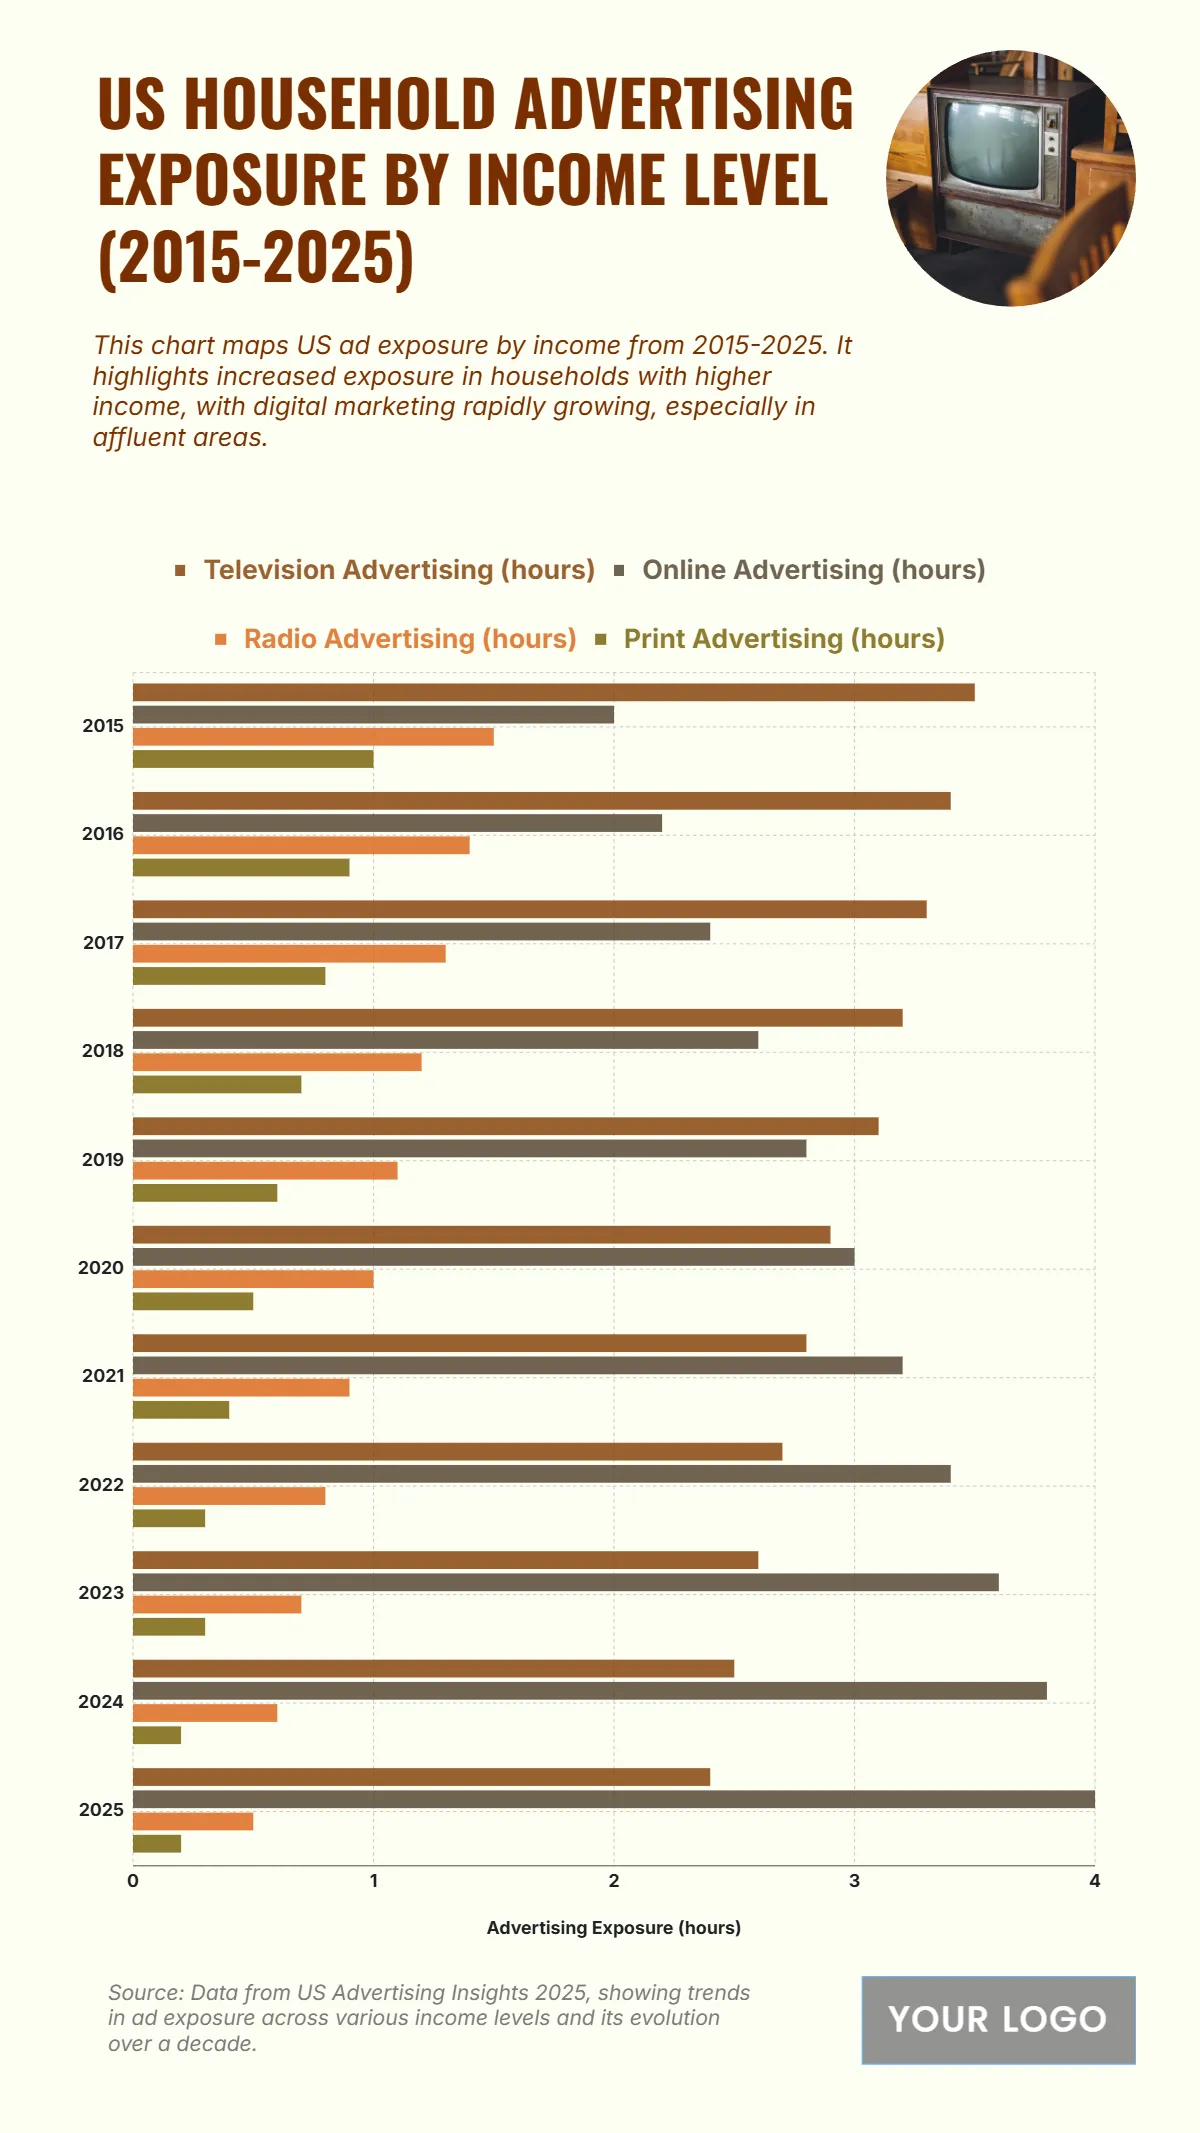
Free US Household Advertising Exposure by Income Level from 2015 to 2025 Chart
The chart shows stable advertising expenditure within the U.S. entertainment industry between 2020 and 2025, with only slight variations in annual totals. Spending remains consistently around USD 39.5 billion in 2020 and demonstrates minimal year-over-year fluctuations, highlighting the sector’s steady investment pattern. The peak occurs in 2023 with USD 40.1 billion, reflecting a notable emphasis on digital platforms during this period. Meanwhile, the 2021 and 2022 values sit close to USD 39.6 billion and USD 39.8 billion, respectively, showing a controlled and gradual rise. By 2024 and 2025, the numbers slightly decline to USD 39.4 billion and USD 39.2 billion, indicating stabilization after the peak year. This trend emphasizes how the entertainment sector maintains high advertising budgets with a strong digital focus, while traditional media investment levels off, showcasing a mature and steady market rather than volatile growth.
| Labels | 2020–2025 Total Advertising (USD billions) |
|---|---|
| 2025 | 40.3 |
| 2020 | 40 |
| 2021 | 39.7 |
| 2024 | 39.5 |
| 2022 | 39.4 |
| 2023 | 39.3 |


