Free US Digital Ad Fraud Losses from 2015 to 2025 Chart
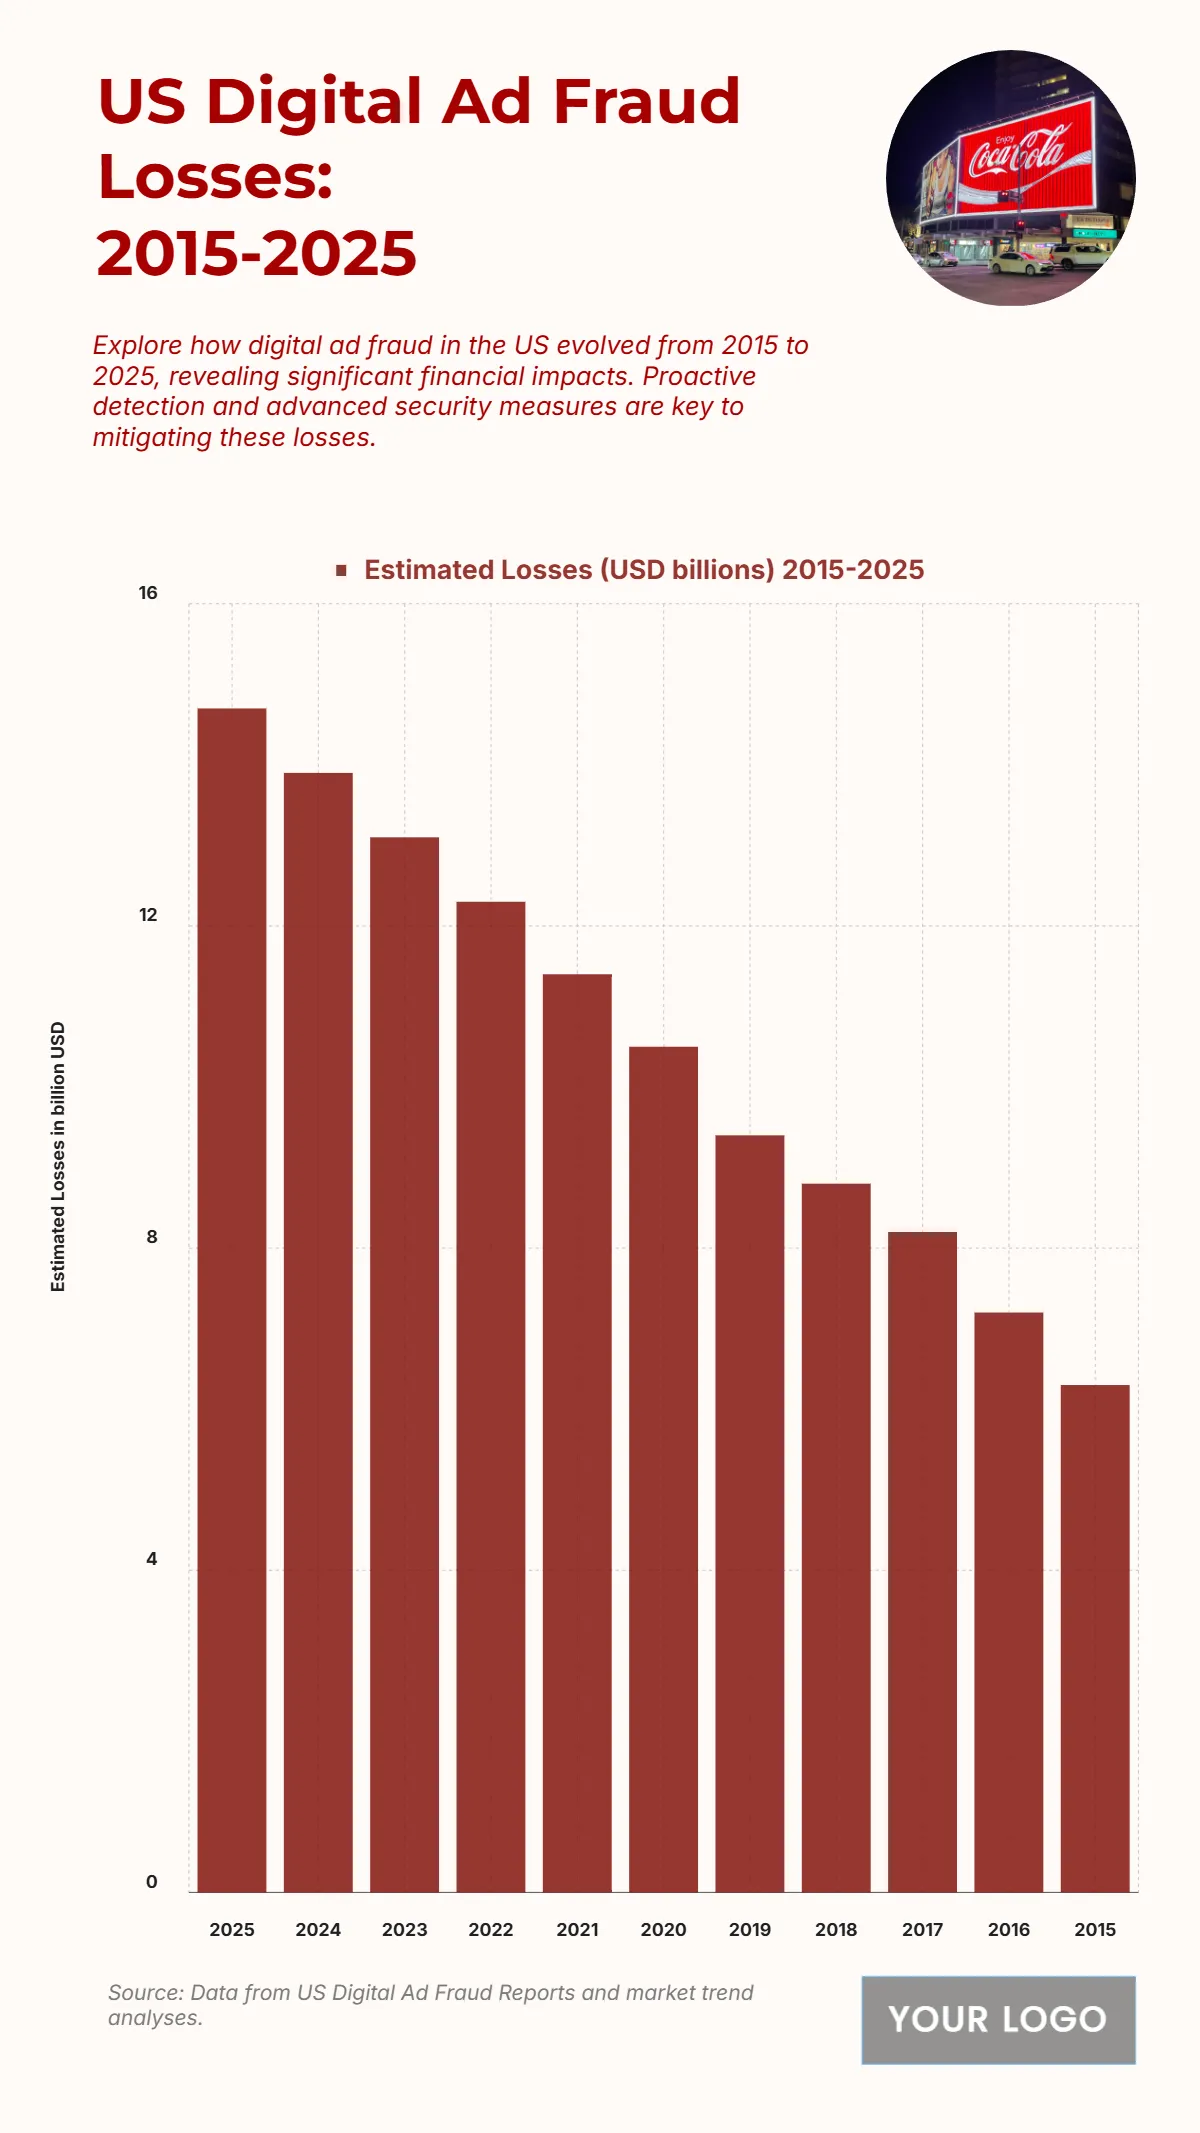
The chart illustrates the estimated financial impact of digital ad fraud in the U.S. from 2015 to 2025, showing a steady upward trend over the decade. Losses in 2015 were at USD 6.5 billion, reflecting relatively lower fraudulent activity compared to later years. The figures increase steadily through 2018 at USD 8.3 billion, indicating growing exploitation of digital advertising platforms. By 2020, losses reached USD 10.5 billion, showing the accelerating threat of sophisticated fraud schemes. The trend continues to rise with 2022 registering USD 12.2 billion and 2024 climbing to USD 14.1 billion, underscoring the expanding scope of fraudulent activity. The peak is projected in 2025 at USD 14.8 billion, the highest in the dataset, signaling an urgent need for stronger security and fraud detection strategies. This consistent increase highlights how digital ad fraud has become a persistent and costly challenge for advertisers and marketers in the digital ecosystem.
| Labels | Estimated Losses (USD billions) 2015–2025 |
|---|---|
| 2025 | 14.7 |
| 2024 | 13.9 |
| 2023 | 13.1 |
| 2022 | 12.3 |
| 2021 | 11.4 |
| 2020 | 10.5 |
| 2019 | 9.4 |
| 2018 | 8.8 |
| 2017 | 8.2 |
| 2016 | 7.2 |
| 2015 | 6.3 |


