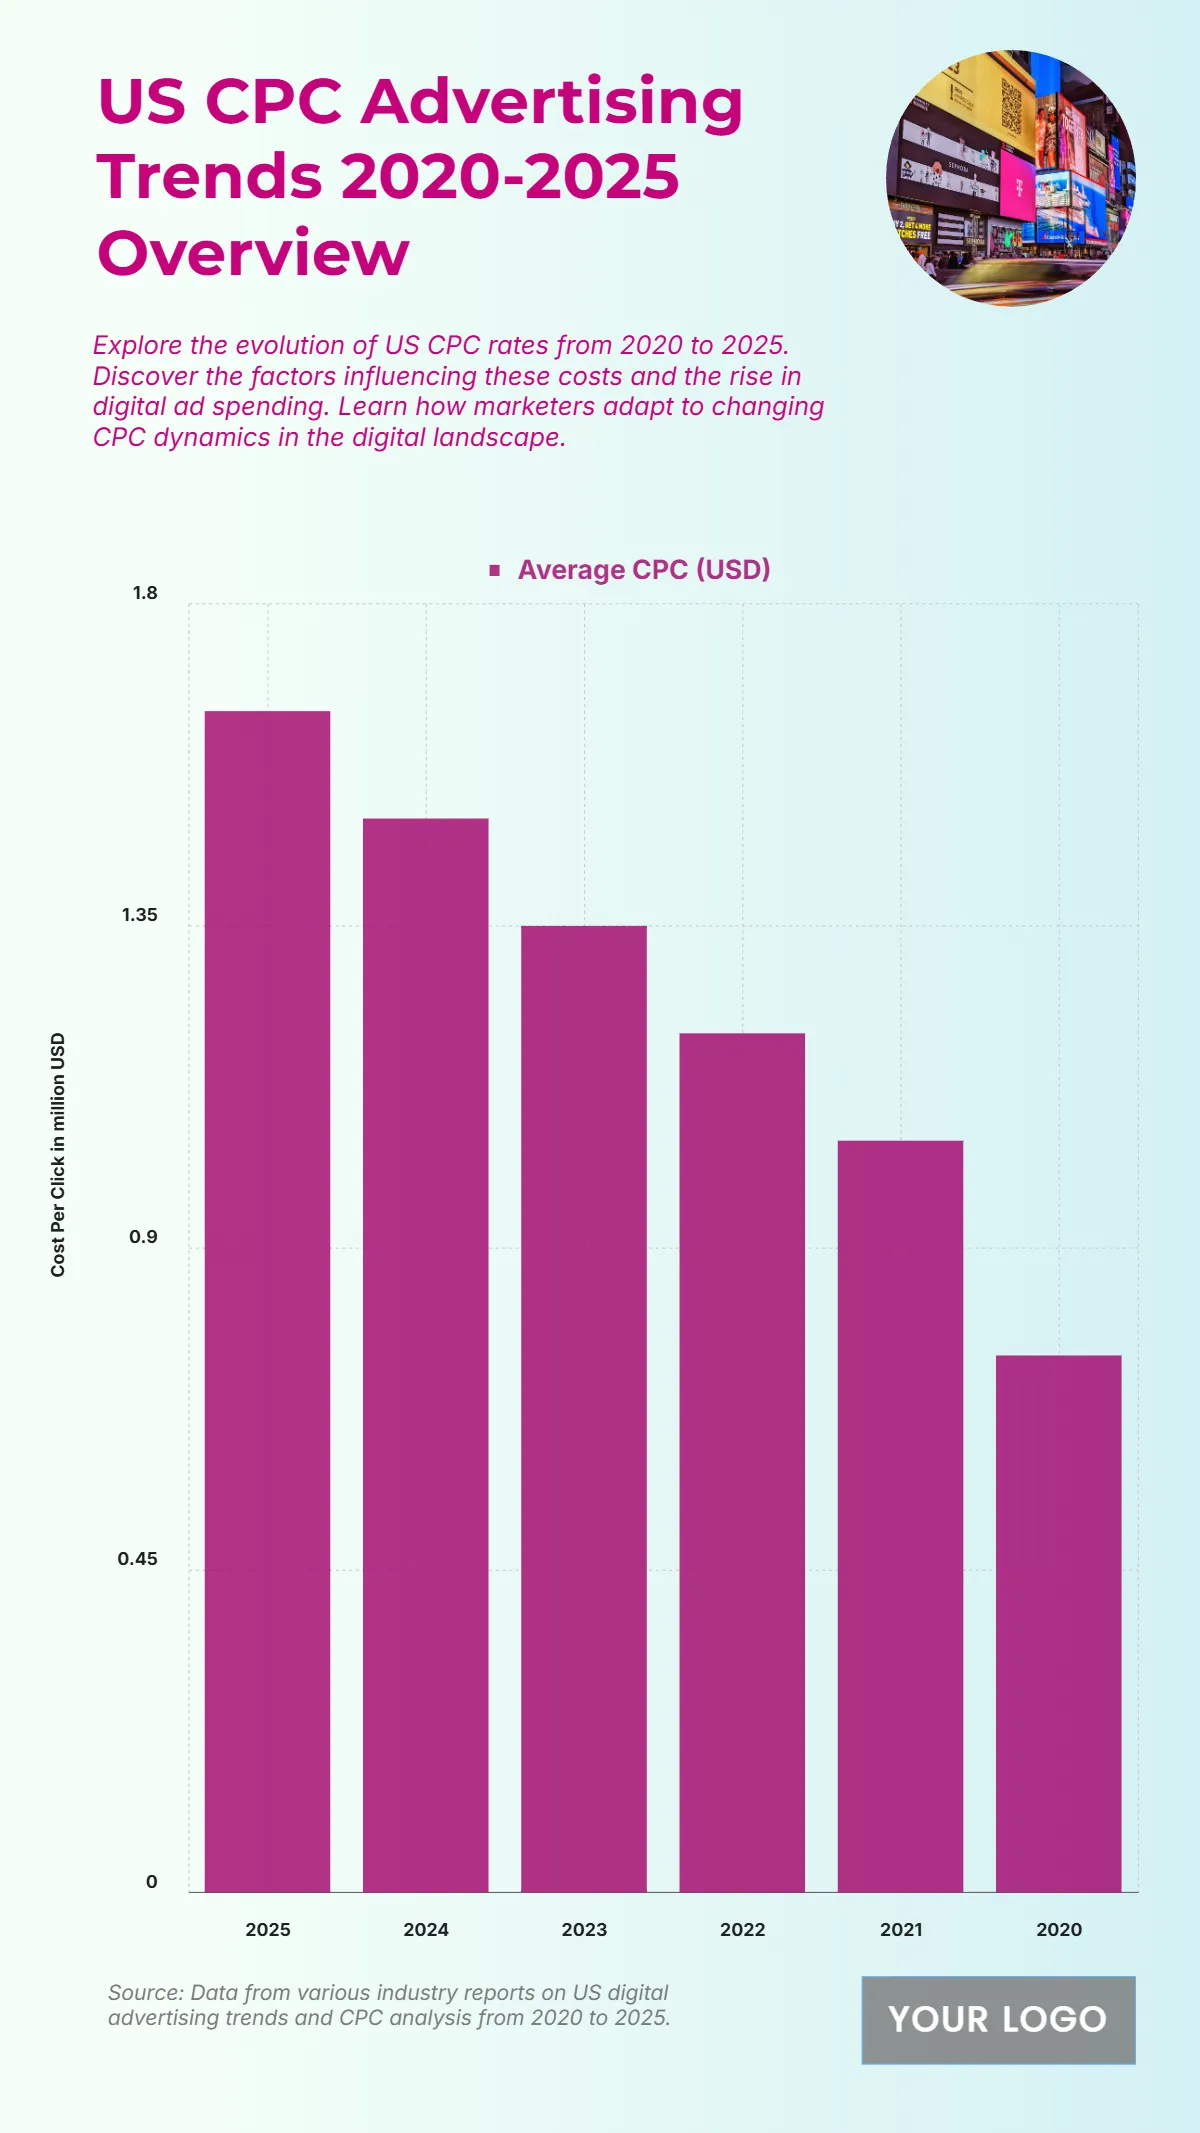
Free US Cost-per-Click (CPC) Advertising Trends from 2020 to 2025 Chart
The chart presents the steady rise in US Cost-Per-Click (CPC) Advertising Trends from 2020 to 2025, showing a clear upward pattern as digital competition intensifies. In 2020, the average CPC stood at USD 0.75, marking the lowest rate in the observed period. The rate increased to USD 1.05 in 2021, reflecting growing advertiser demand for online visibility. By 2022, the CPC reached USD 1.20, and in 2023, it climbed to USD 1.35, showcasing continuous year-on-year growth. The momentum carried into 2024, with an average CPC of USD 1.50, indicating intensified competition across search and social platforms. Finally, 2025 recorded the highest value at USD 1.65, highlighting how rising ad costs align with market saturation, increased targeting precision, and expanded digital ad investments across industries.
| Labels | Average CPC (USD) |
|---|---|
| 2025 | 1.65 |
| 2024 | 1.50 |
| 2023 | 1.35 |
| 2022 | 1.20 |
| 2021 | 1.05 |
| 2020 | 0.75 |


