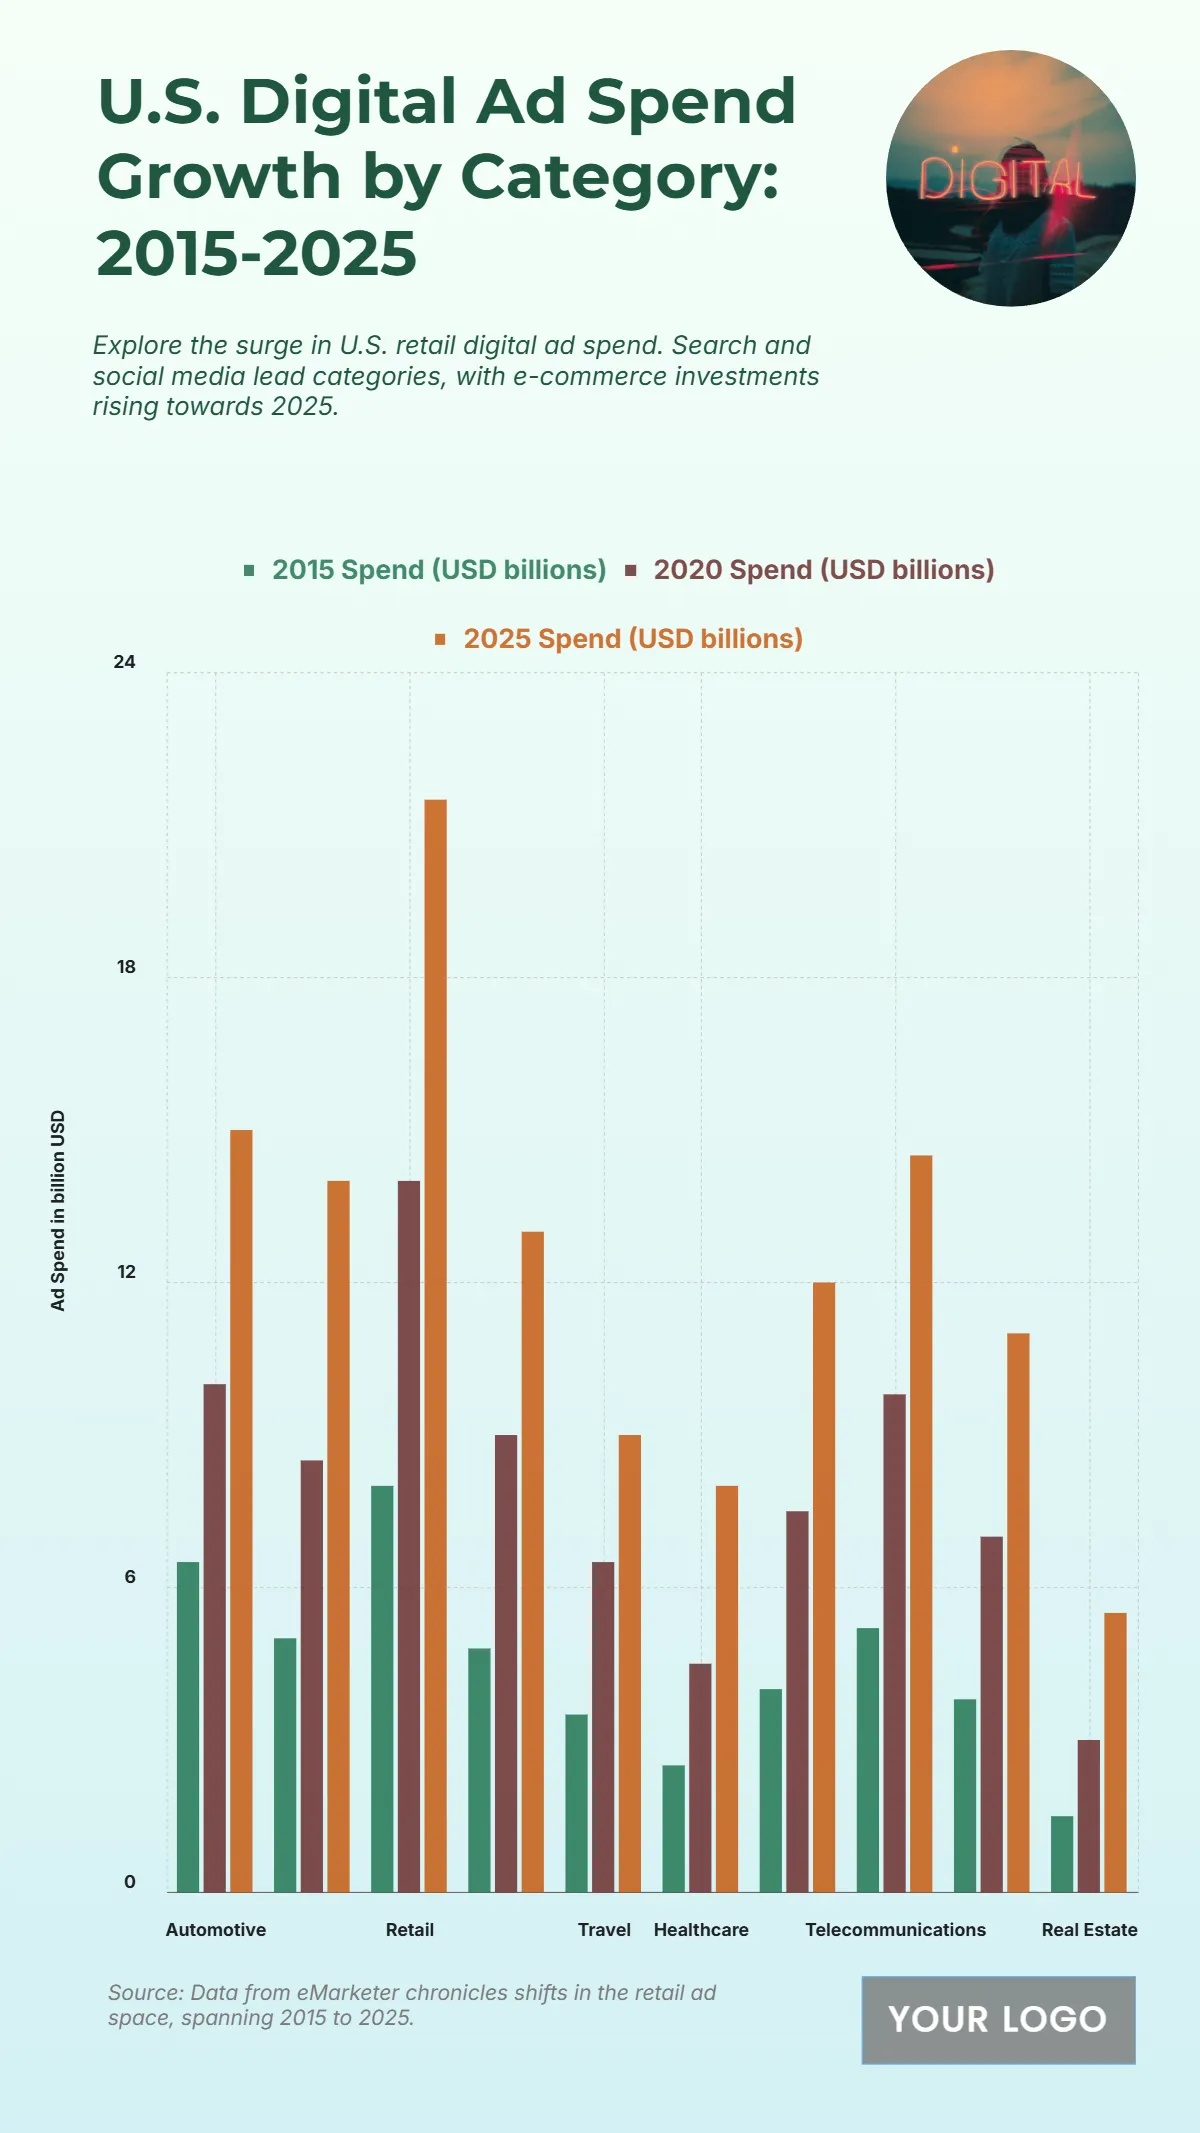
Free US Retail Digital Advertising Spend by Category from 2015 to 2025 Chart
The chart illustrates the rising U.S. digital ad spend across major industries from 2015 to 2025, showing significant growth as businesses continue to embrace online marketing strategies. The Retail sector dominates, increasing from USD 8 billion in 2015 to USD 21.5 billion in 2025, driven by e-commerce expansion. Automotive follows, growing from USD 6.5 billion to USD 15 billion, while Consumer Electronics climbs from USD 5 billion to USD 14 billion over the same period. Financial Services also rises notably from USD 4.8 billion in 2015 to USD 13 billion in 2025. Telecommunications and Media & Entertainment expand to USD 14.5 billion and USD 12 billion, respectively. Meanwhile, Healthcare doubles its spend from USD 2.5 billion to USD 8 billion, and Real Estate grows from USD 1.5 billion to USD 5.5 billion. The consistent upward trend reflects the strong digital transformation across all categories.
| Labels | 2015 Spend (USD billions) | 2020 Spend (USD billions) | 2025 Spend (USD billions) |
|---|---|---|---|
| Automotive | 6.5 | 10 | 15 |
| Consumer Electronics | 5 | 8.5 | 14 |
| Retail | 8 | 14 | 21.5 |
| Financial Services | 4.8 | 9 | 13 |
| Travel | 3.5 | 6.5 | 9 |
| Healthcare | 2.5 | 4.5 | 8 |
| Media & Entertainment | 4 | 7.5 | 12 |
| Telecommunications | 5.2 | 9.8 | 14.5 |
| CPG & Consumer Goods | 3.8 | 7 | 11 |
| Real Estate | 1.5 | 3 | 5.5 |


