Free US Automotive Advertising Expenditure from 2015 to 2025 Chart
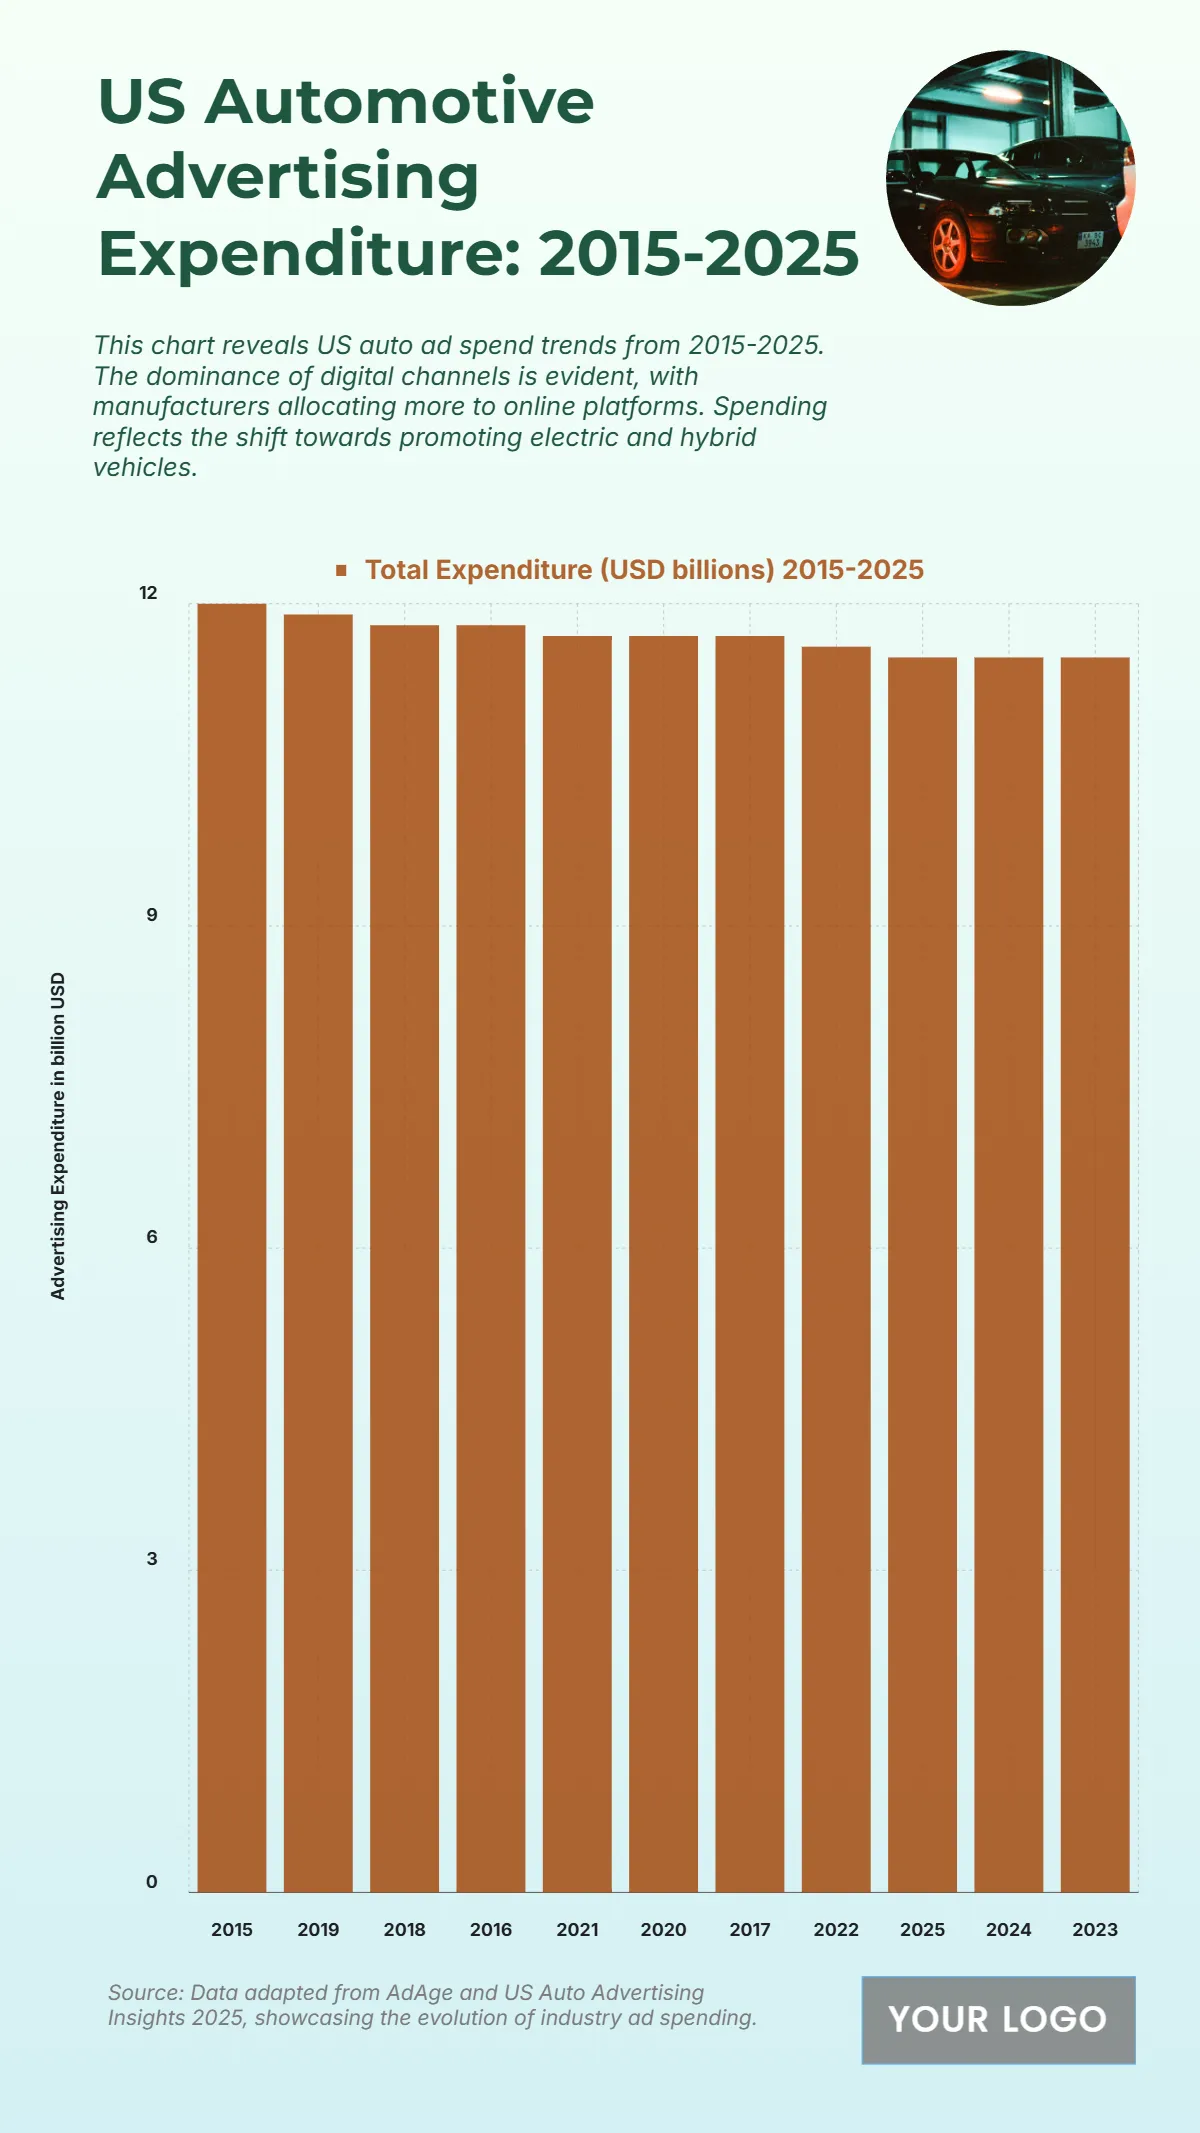
The chart displays the US Automotive Advertising Expenditure from 2015 to 2025, revealing a relatively stable trend over the decade. In 2015, total expenditure stood at USD 12 billion, marking the peak of the period. From 2016 to 2018, spending slightly decreased but remained consistent between USD 11.8 billion and USD 11.9 billion, reflecting the automotive industry’s steady digital marketing investments. Between 2019 and 2021, spending averaged USD 11.7 billion, showing minor fluctuations as brands adapted to evolving consumer behaviors and the pandemic’s impact. In 2022, expenditures eased to USD 11.6 billion, while projections for 2023 to 2025 indicate stabilization at USD 11.5 billion. Overall, the data underscores a mature and stable advertising landscape for the automotive sector, where digital platforms dominate and manufacturers focus increasingly on promoting electric and hybrid vehicles while maintaining consistent ad budgets.
| Labels | Total Expenditure (USD billions) 2015–2025 |
|---|---|
| 2015 | 12.0 |
| 2019 | 11.9 |
| 2018 | 11.8 |
| 2016 | 11.8 |
| 2021 | 11.7 |
| 2020 | 11.7 |
| 2017 | 11.7 |
| 2022 | 11.6 |
| 2025 | 11.5 |
| 2024 | 11.5 |
| 2023 | 11.5 |


