Free US Ad Spending Share by Device Type from 2015 to 2025 Chart
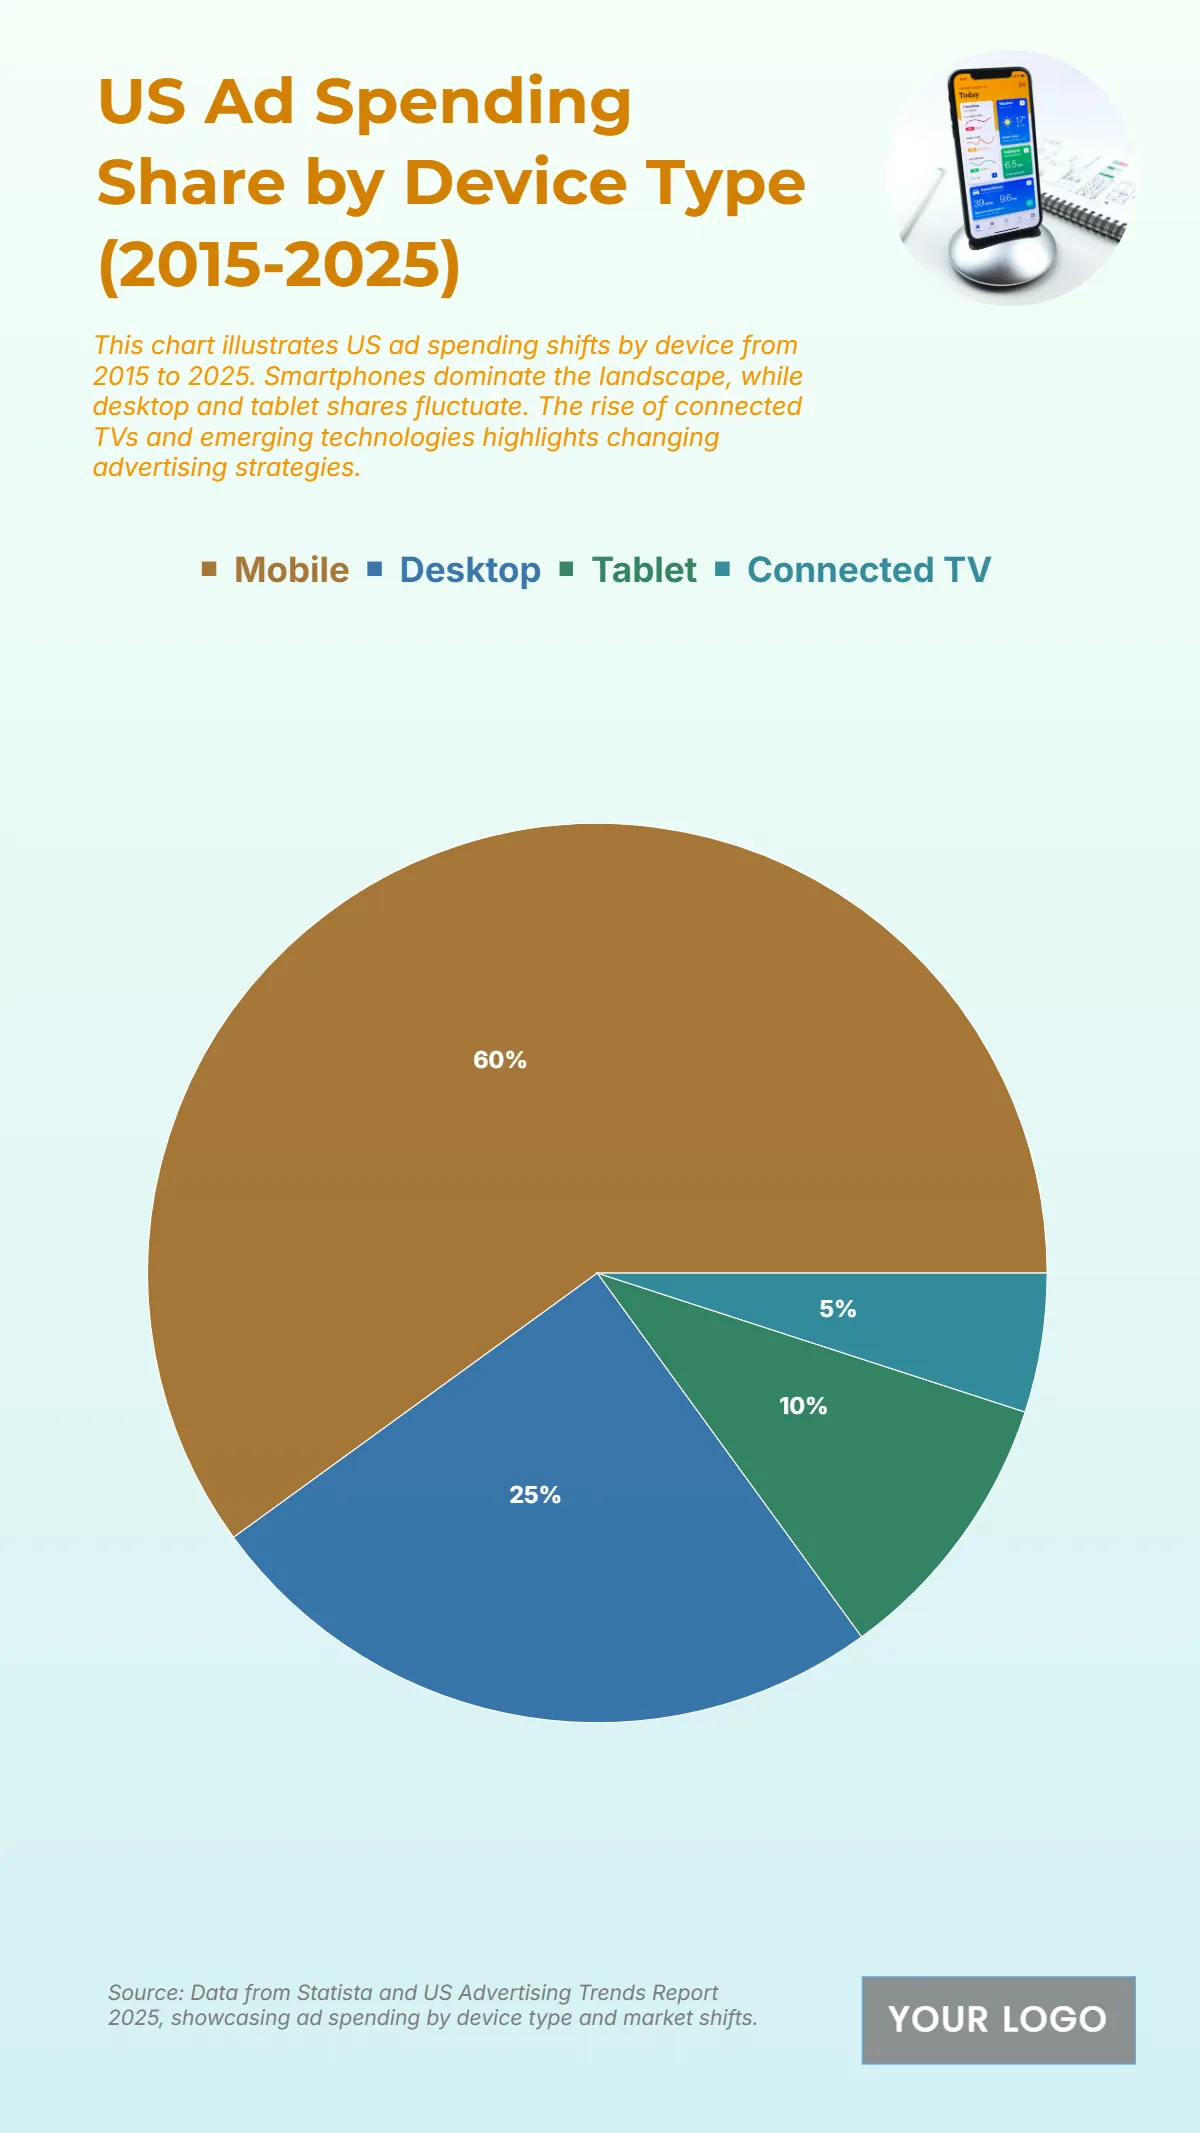
The chart illustrates the distribution of US Ad Spending Share by Device Type from 2015 to 2025, emphasizing the dominant role of mobile platforms in the advertising landscape. Mobile devices account for the largest share at 60%, showcasing the massive shift toward smartphone-based advertising as consumers increasingly engage through mobile apps and social media. Desktop advertising follows with 25%, maintaining relevance for professional and e-commerce audiences but reflecting a steady decline compared to previous years. Tablet advertising represents 10%, indicating moderate engagement levels driven by entertainment and shopping use. Meanwhile, Connected TV holds 5%, signaling emerging opportunities for advertisers leveraging streaming platforms and smart TVs. The data highlights the growing preference for mobile-first strategies and evolving multi-device campaigns as technology continues to shape digital marketing priorities.
| Labels | Ad Spending Share (%) |
|---|---|
| Mobile | 60 |
| Desktop | 25 |
| Tablet | 10 |
| Connected TV | 5 |


