Free US Online vs Offline Advertising Spend from 2015 to 2025 Chart
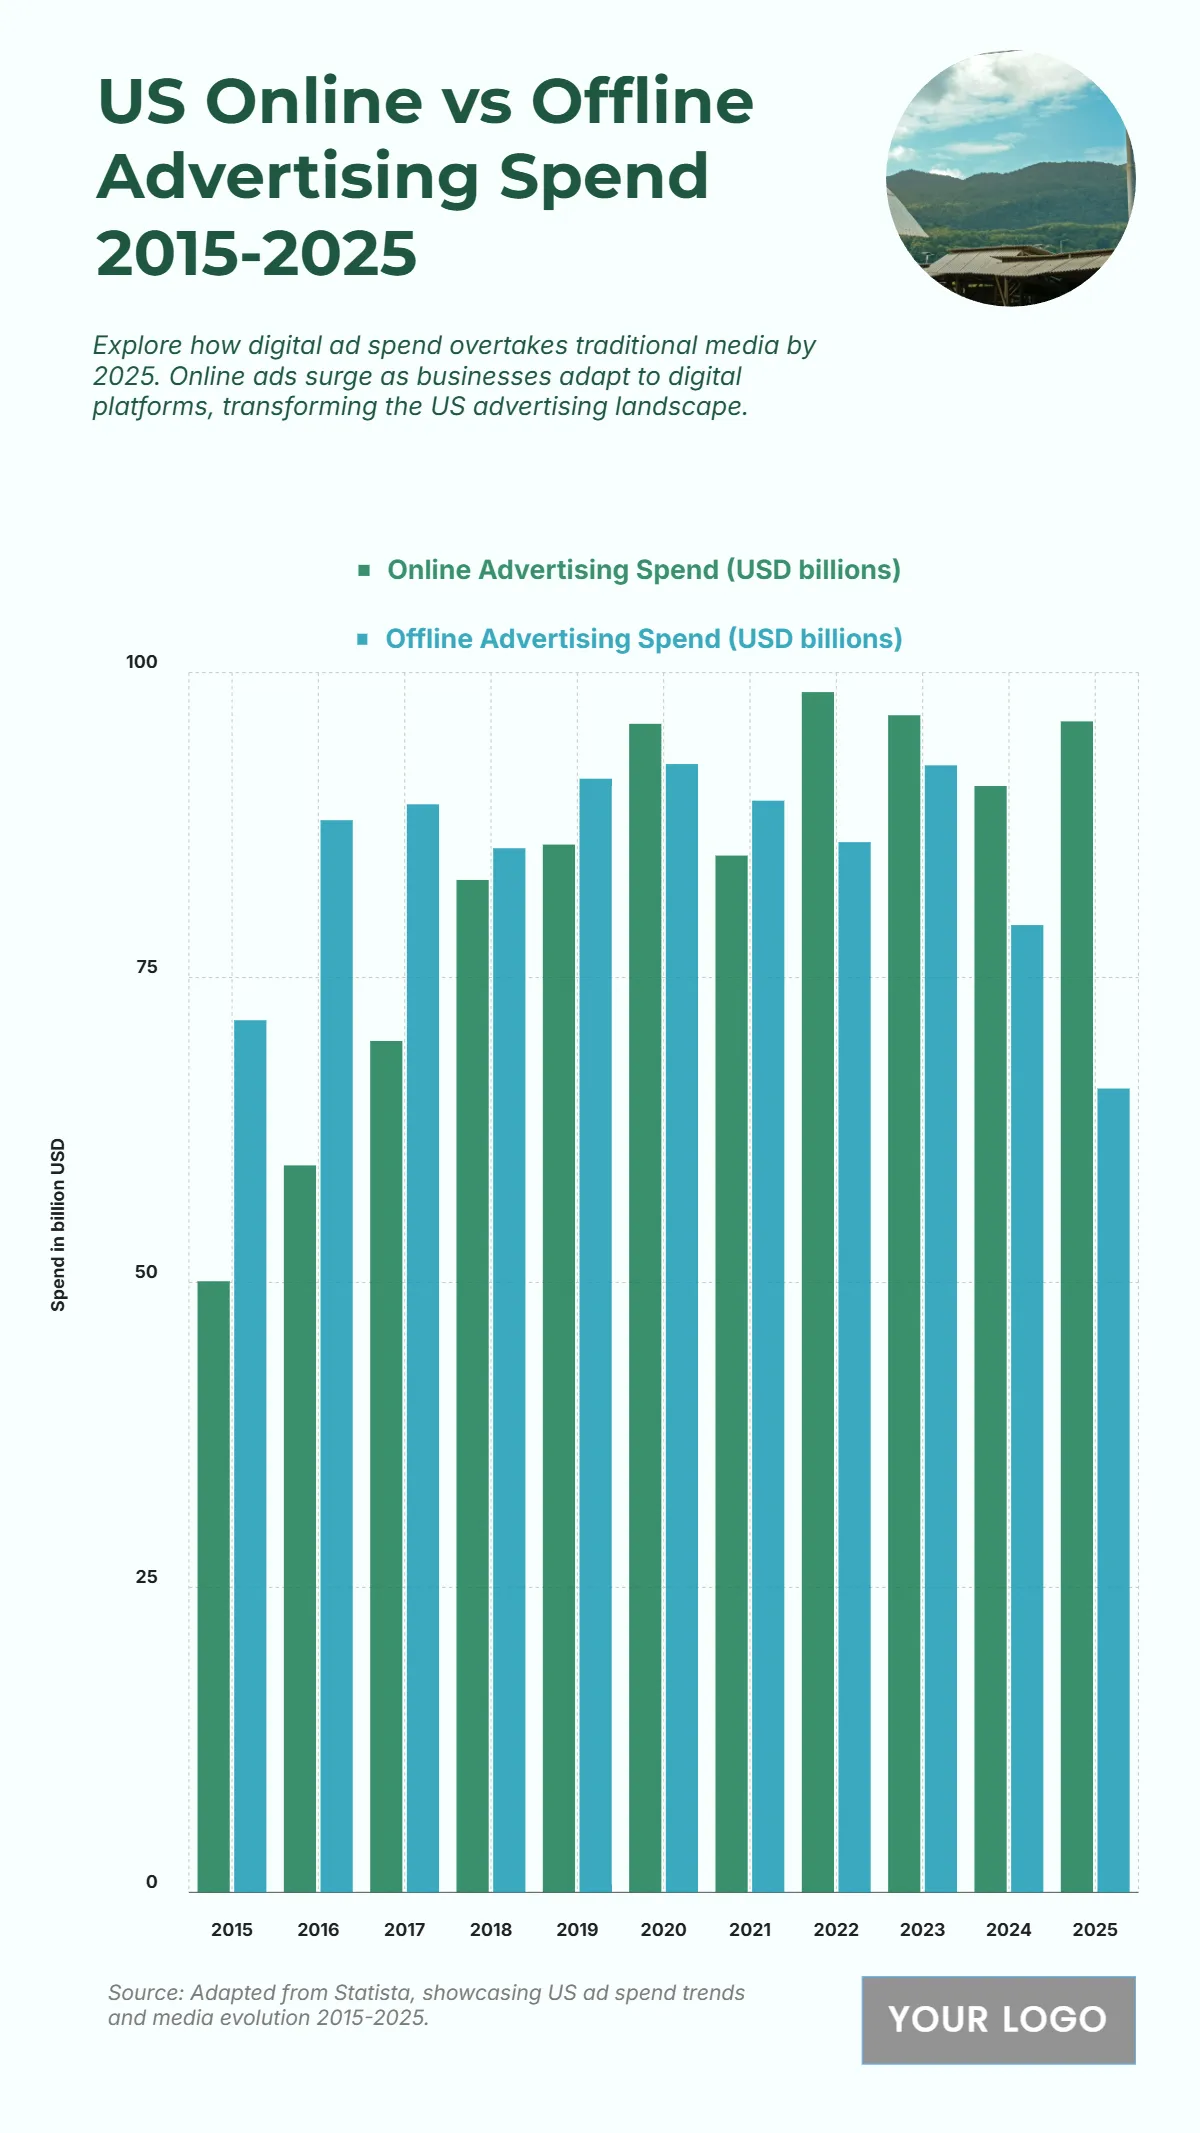
The chart compares US Online and Offline Advertising Spend from 2015 to 2025, highlighting the shift toward digital platforms as businesses increasingly invest in online media. In 2015, online spending was USD 50.1 billion, significantly lower than offline’s USD 71.5 billion. However, by 2018, online ads surged to USD 83 billion, nearly matching offline’s USD 85.6 billion, marking the start of digital dominance. The upward trend continued, with 2020 reaching USD 95.8 billion online compared to USD 92.5 billion offline. The gap widened further by 2022, where online spending peaked at USD 98.4 billion, while offline declined to USD 86.1 billion. By 2025, projections show online ads at USD 96 billion versus offline’s USD 65.9 billion, confirming the digital takeover. The data underscores how advertisers are prioritizing online engagement, performance analytics, and digital reach over traditional media channels.
| Labels | Online Advertising Spend (USD billions) | Offline Advertising Spend (USD billions) |
|---|---|---|
| 2015 | 50.1 | 71.5 |
| 2016 | 59.6 | 87.9 |
| 2017 | 69.8 | 89.2 |
| 2018 | 83.0 | 85.6 |
| 2019 | 85.9 | 91.3 |
| 2020 | 95.8 | 92.5 |
| 2021 | 85.0 | 89.5 |
| 2022 | 98.4 | 86.1 |
| 2023 | 96.5 | 92.4 |
| 2024 | 90.7 | 79.3 |
| 2025 | 96.0 | 65.9 |


