Free US Political Digital Advertising Trends from 2020 to 2025 Chart
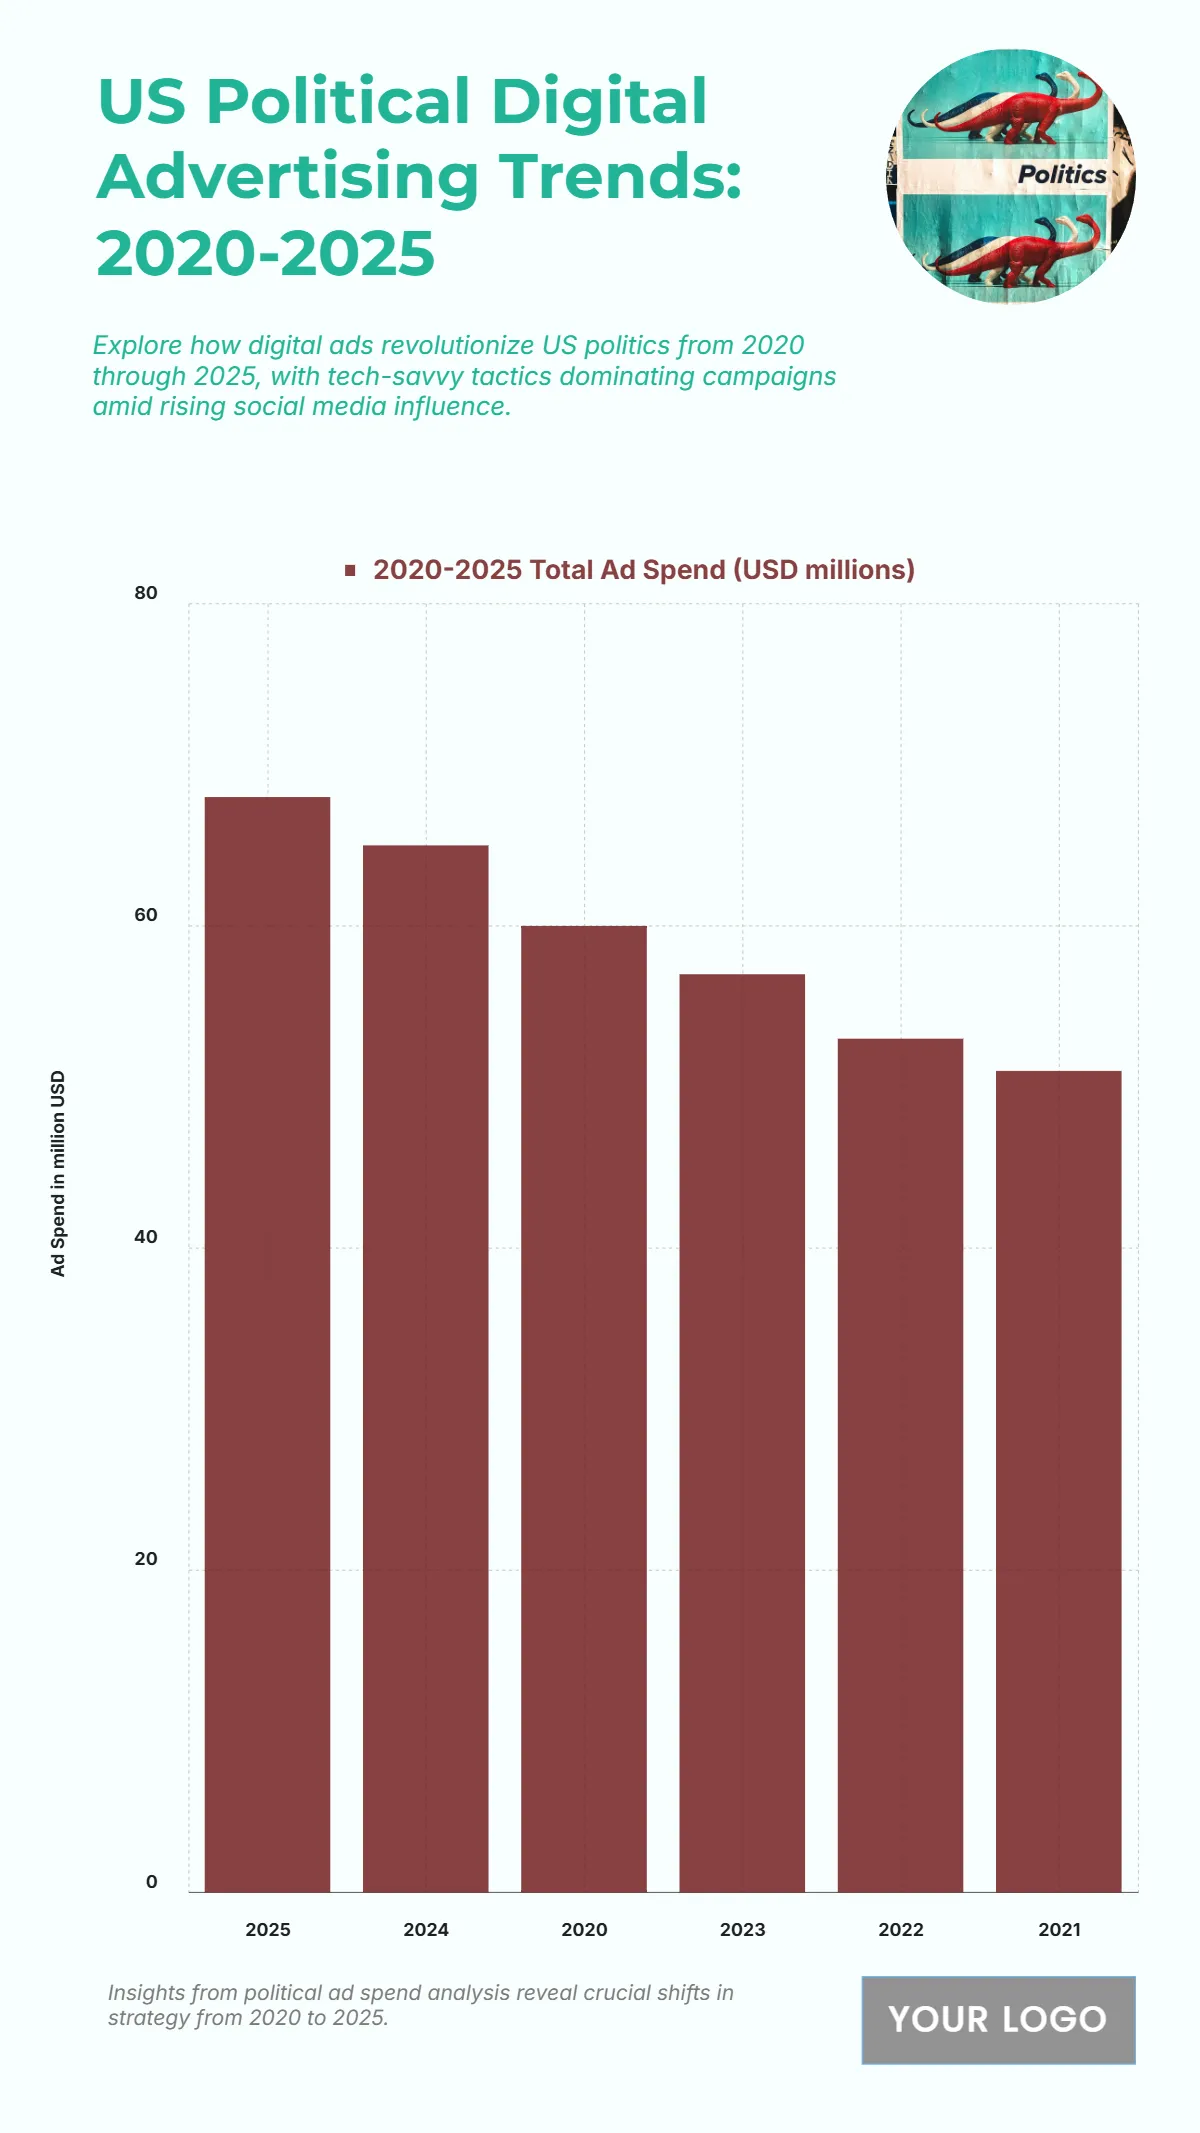
The chart depicts the steady growth of US Political Digital Advertising Spend from 2020 to 2025, reflecting the increasing reliance on digital platforms for campaign communication and voter engagement. In 2020, total ad spending reached USD 60 million, marking the start of a digital surge driven by online mobilization efforts. Spending slightly increased to USD 51 million in 2021 and USD 53 million in 2022, maintaining momentum through non-election years. By 2023, ad expenditures rose to USD 57 million, while 2024, an election year, saw a notable jump to USD 65 million as parties intensified their digital outreach. The projection for 2025 shows a peak at USD 68 million, emphasizing how political campaigns continue to prioritize social media, video ads, and data-driven targeting strategies. The consistent upward trend underscores the central role of digital marketing in modern U.S. political strategy.
| Labels | 2020–2025 Total Ad Spend (USD millions) |
|---|---|
| 2025 | 68 |
| 2024 | 65 |
| 2020 | 60 |
| 2023 | 57 |
| 2022 | 53 |
| 2021 | 51 |


