Free US Small Business Advertising Expenditure Trends from 2015 to 2025 Chart
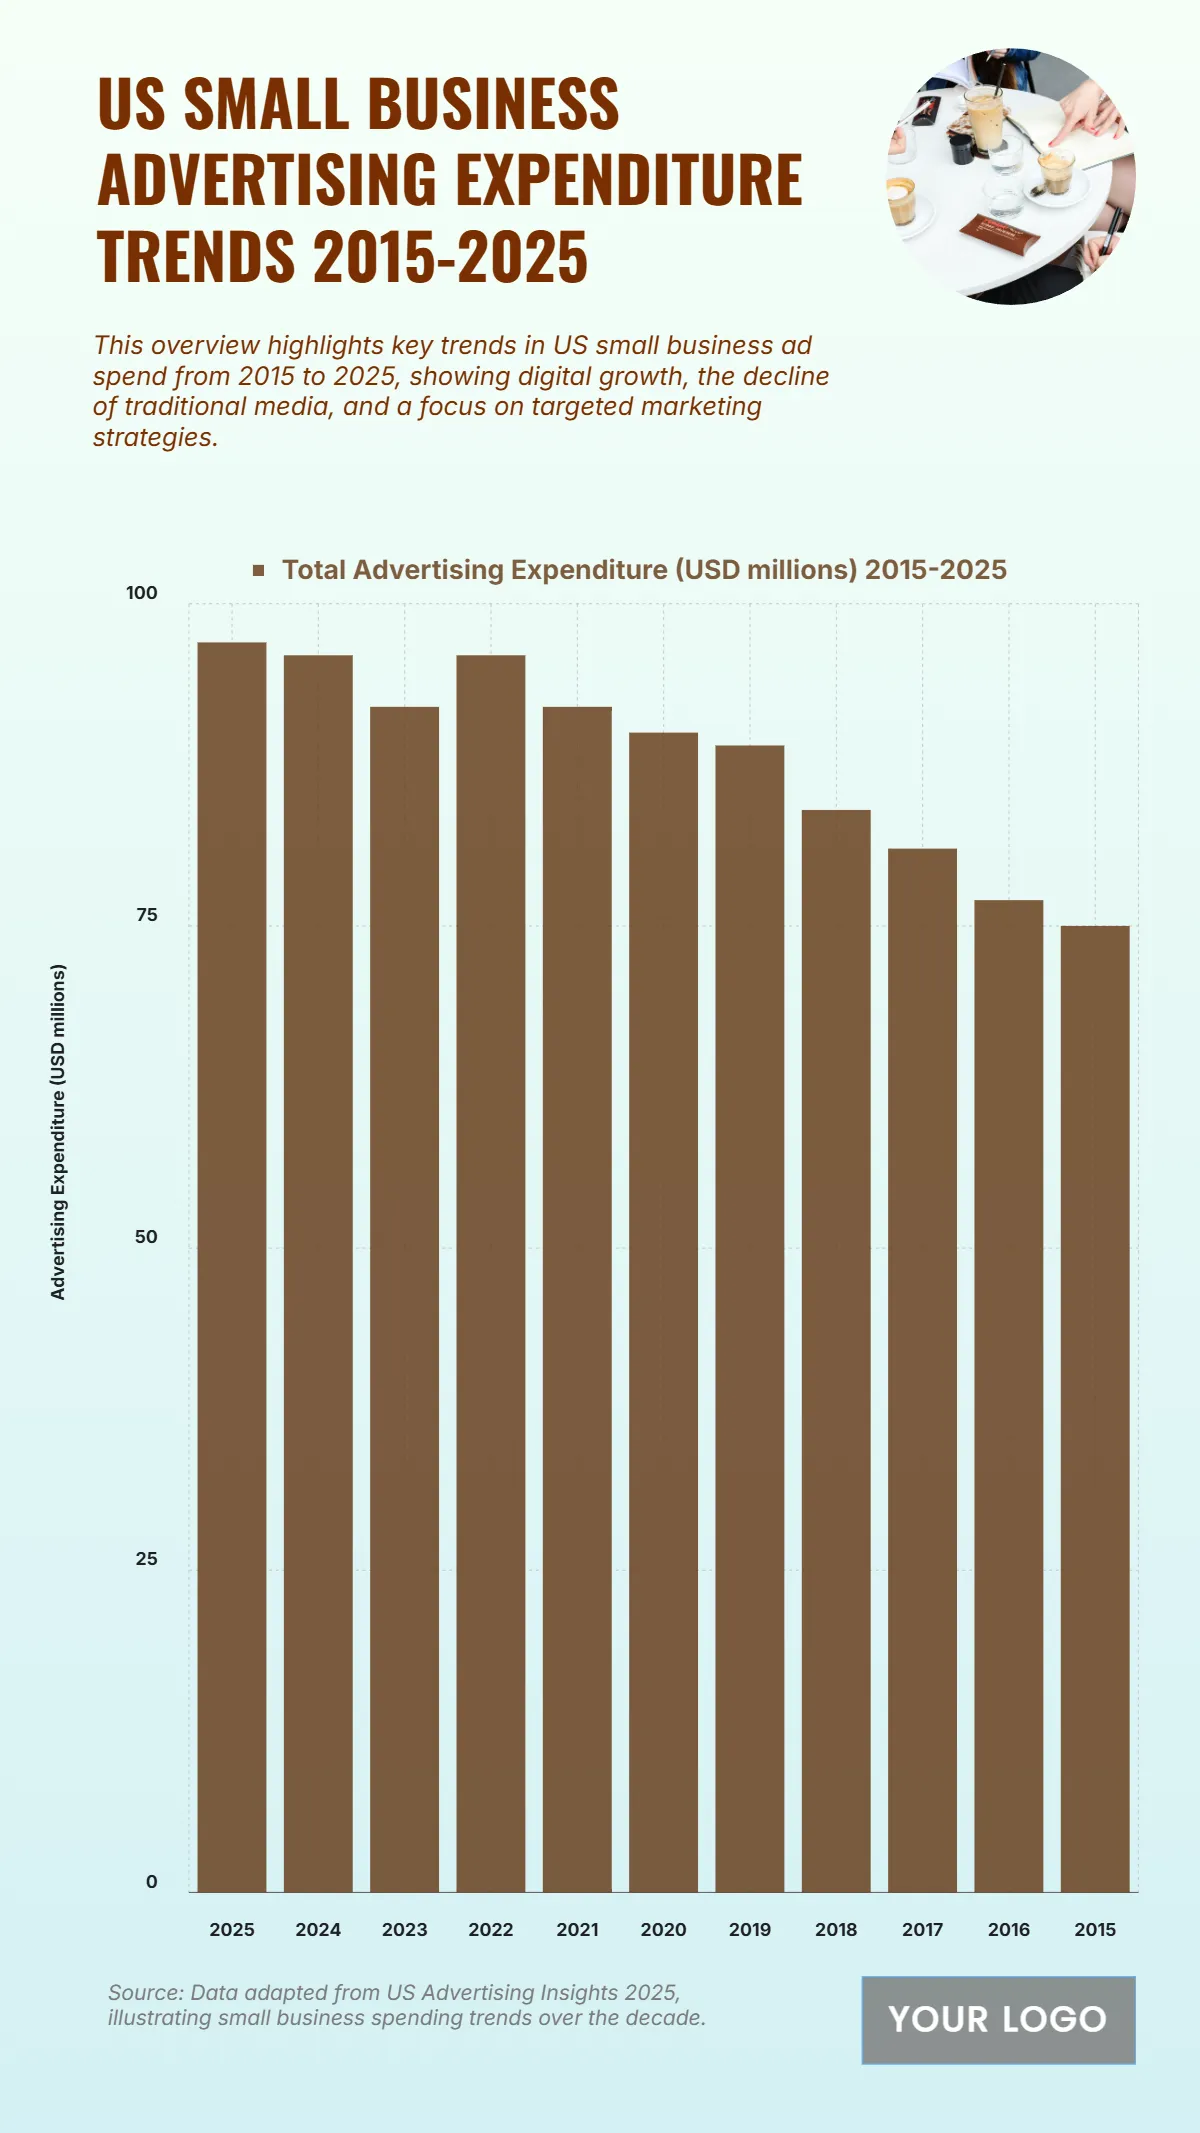
The chart illustrates the pattern of US Small Business Advertising Expenditure from 2015 to 2025, showing a decade of relatively stable spending with slight fluctuations. In 2015, total expenditure was USD 75 million, gradually increasing to USD 77 million in 2016 and USD 81 million in 2017, as small businesses began embracing digital marketing tools. The upward trend continued to USD 84 million in 2018 and USD 89 million in 2019, reflecting growing online advertising adoption. Spending peaked at USD 92 million between 2020 and 2023, showing a steady focus on maintaining visibility amid competitive markets. In 2024, spending reached USD 96 million, with 2025 projected at USD 97 million, marking a modest increase. This data highlights how small businesses steadily invest in advertising, balancing traditional and digital strategies while prioritizing targeted and cost-effective campaigns over the decade.
| Labels | Total Advertising Expenditure (USD millions) 2015–2025 |
|---|---|
| 2025 | 97 |
| 2024 | 96 |
| 2023 | 92 |
| 2022 | 96 |
| 2021 | 92 |
| 2020 | 90 |
| 2019 | 89 |
| 2018 | 84 |
| 2017 | 81 |
| 2016 |


