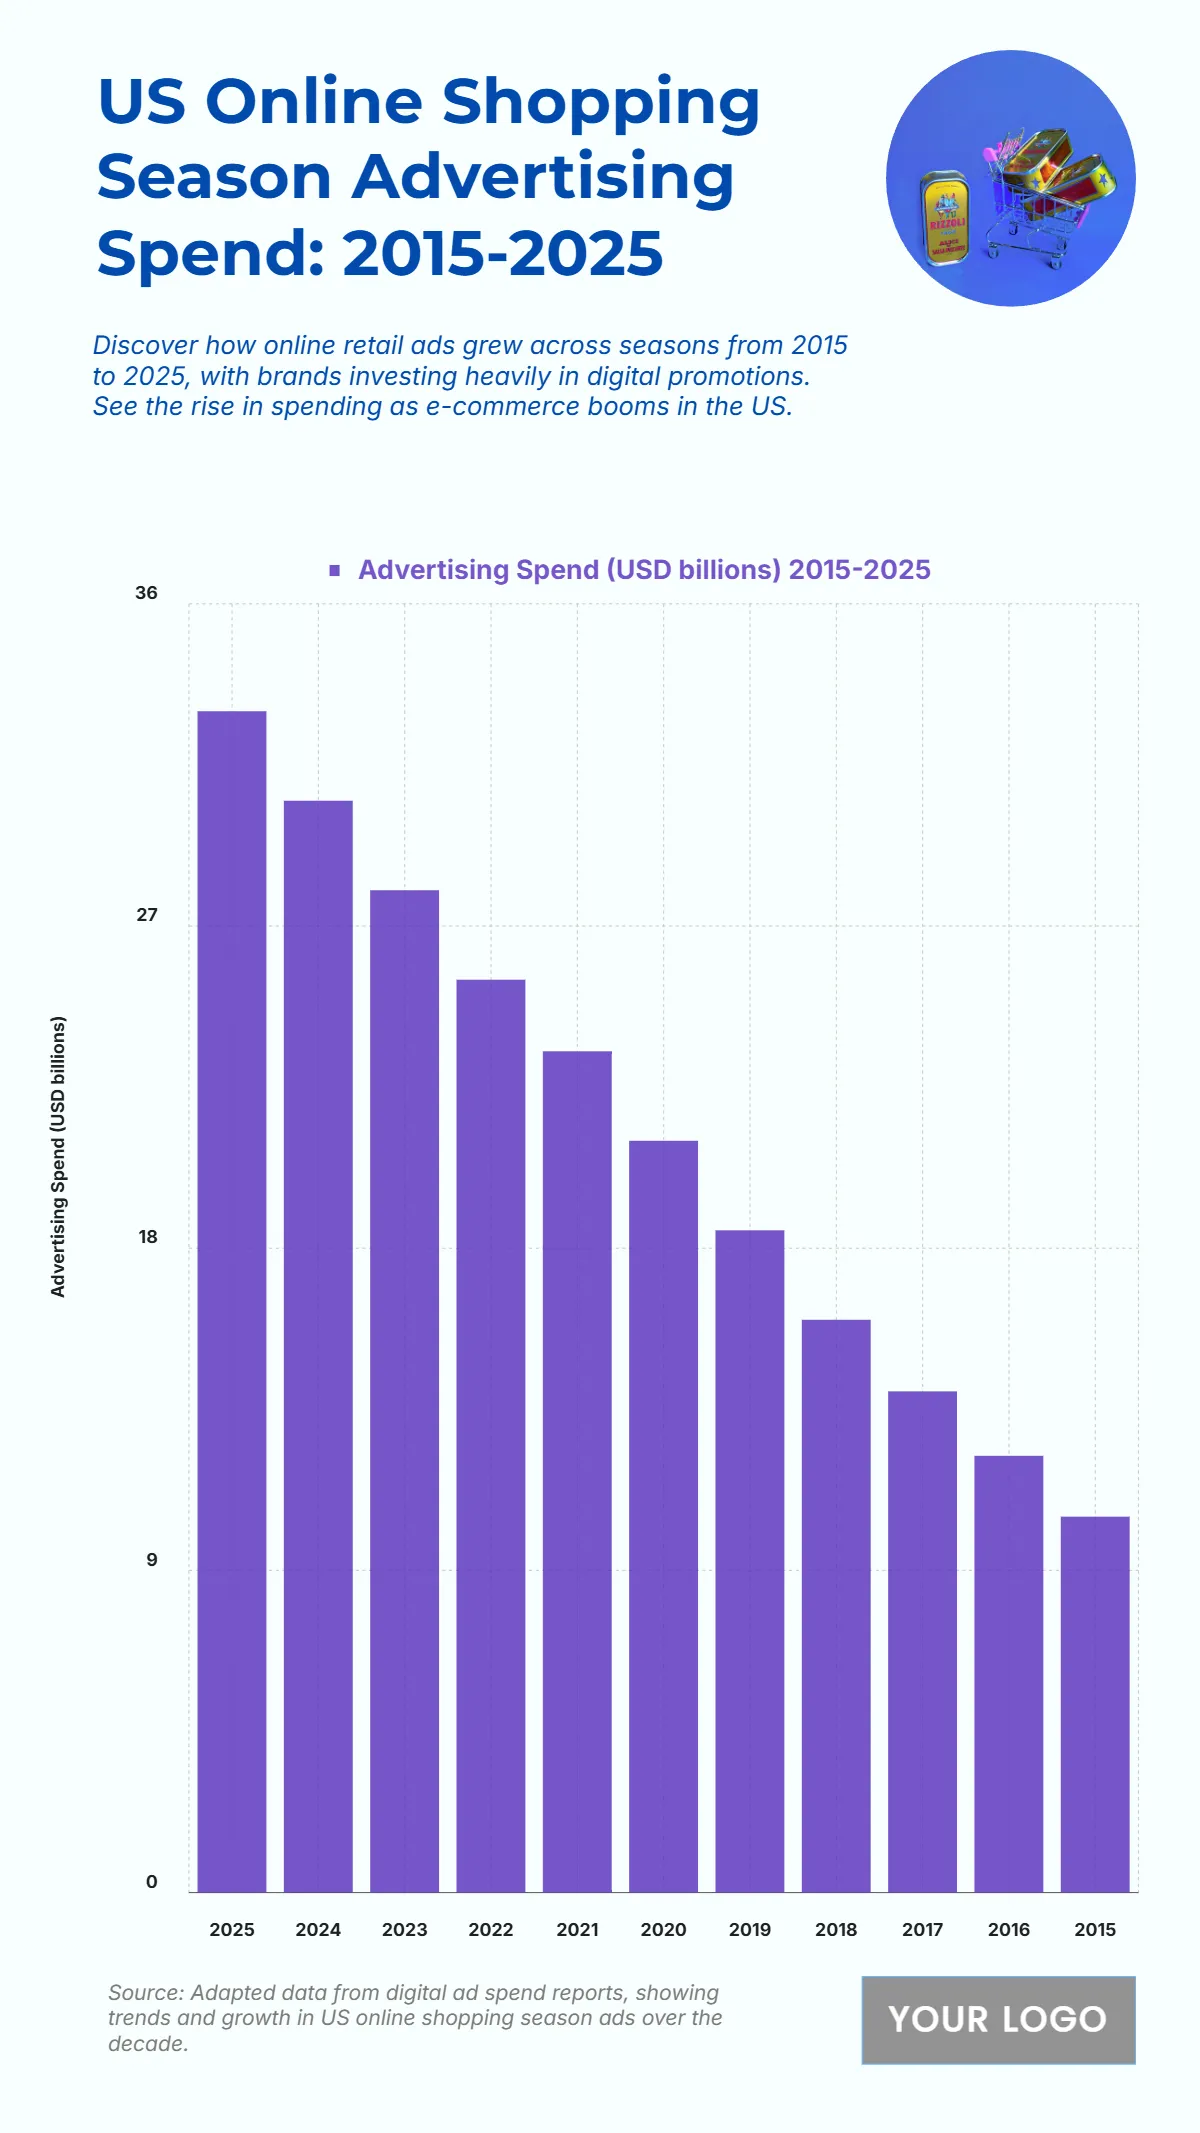
Free US Online Shopping Season Advertising Spend from 2015 to 2025 Chart
The chart shows the steady increase in US Online Shopping Season Advertising Spend between 2015 and 2025, reflecting the significant growth of digital retail promotions. In 2015, the spend was USD 10.5 billion, rising gradually to USD 12.2 billion in 2016 and USD 14 billion in 2017, as e-commerce began its upward trend. By 2018, it reached USD 16 billion, continuing to climb to USD 18.5 billion in 2019 and USD 21 billion in 2020, marking a sharp increase driven by online shopping behavior. The trend strengthened further with USD 23.5 billion in 2021, USD 25.5 billion in 2022, and USD 28 billion in 2023. In 2024, spending rose to USD 30.5 billion, and by 2025, it peaked at USD 33 billion, nearly tripling its 2015 value. This upward pattern highlights how brands are increasingly investing in seasonal digital promotions to capture online consumer demand.
| Labels | Advertising Spend (USD billions) 2015–2025 |
|---|---|
| 2025 | 33 |
| 2024 | 30.5 |
| 2023 | 28 |
| 2022 | 25.5 |
| 2021 | 23.5 |
| 2020 | 21 |
| 2019 | 18.5 |
| 2018 | 16 |
| 2017 | 14 |
| 2016 | 12.2 |
| 2015 | 10.5 |


