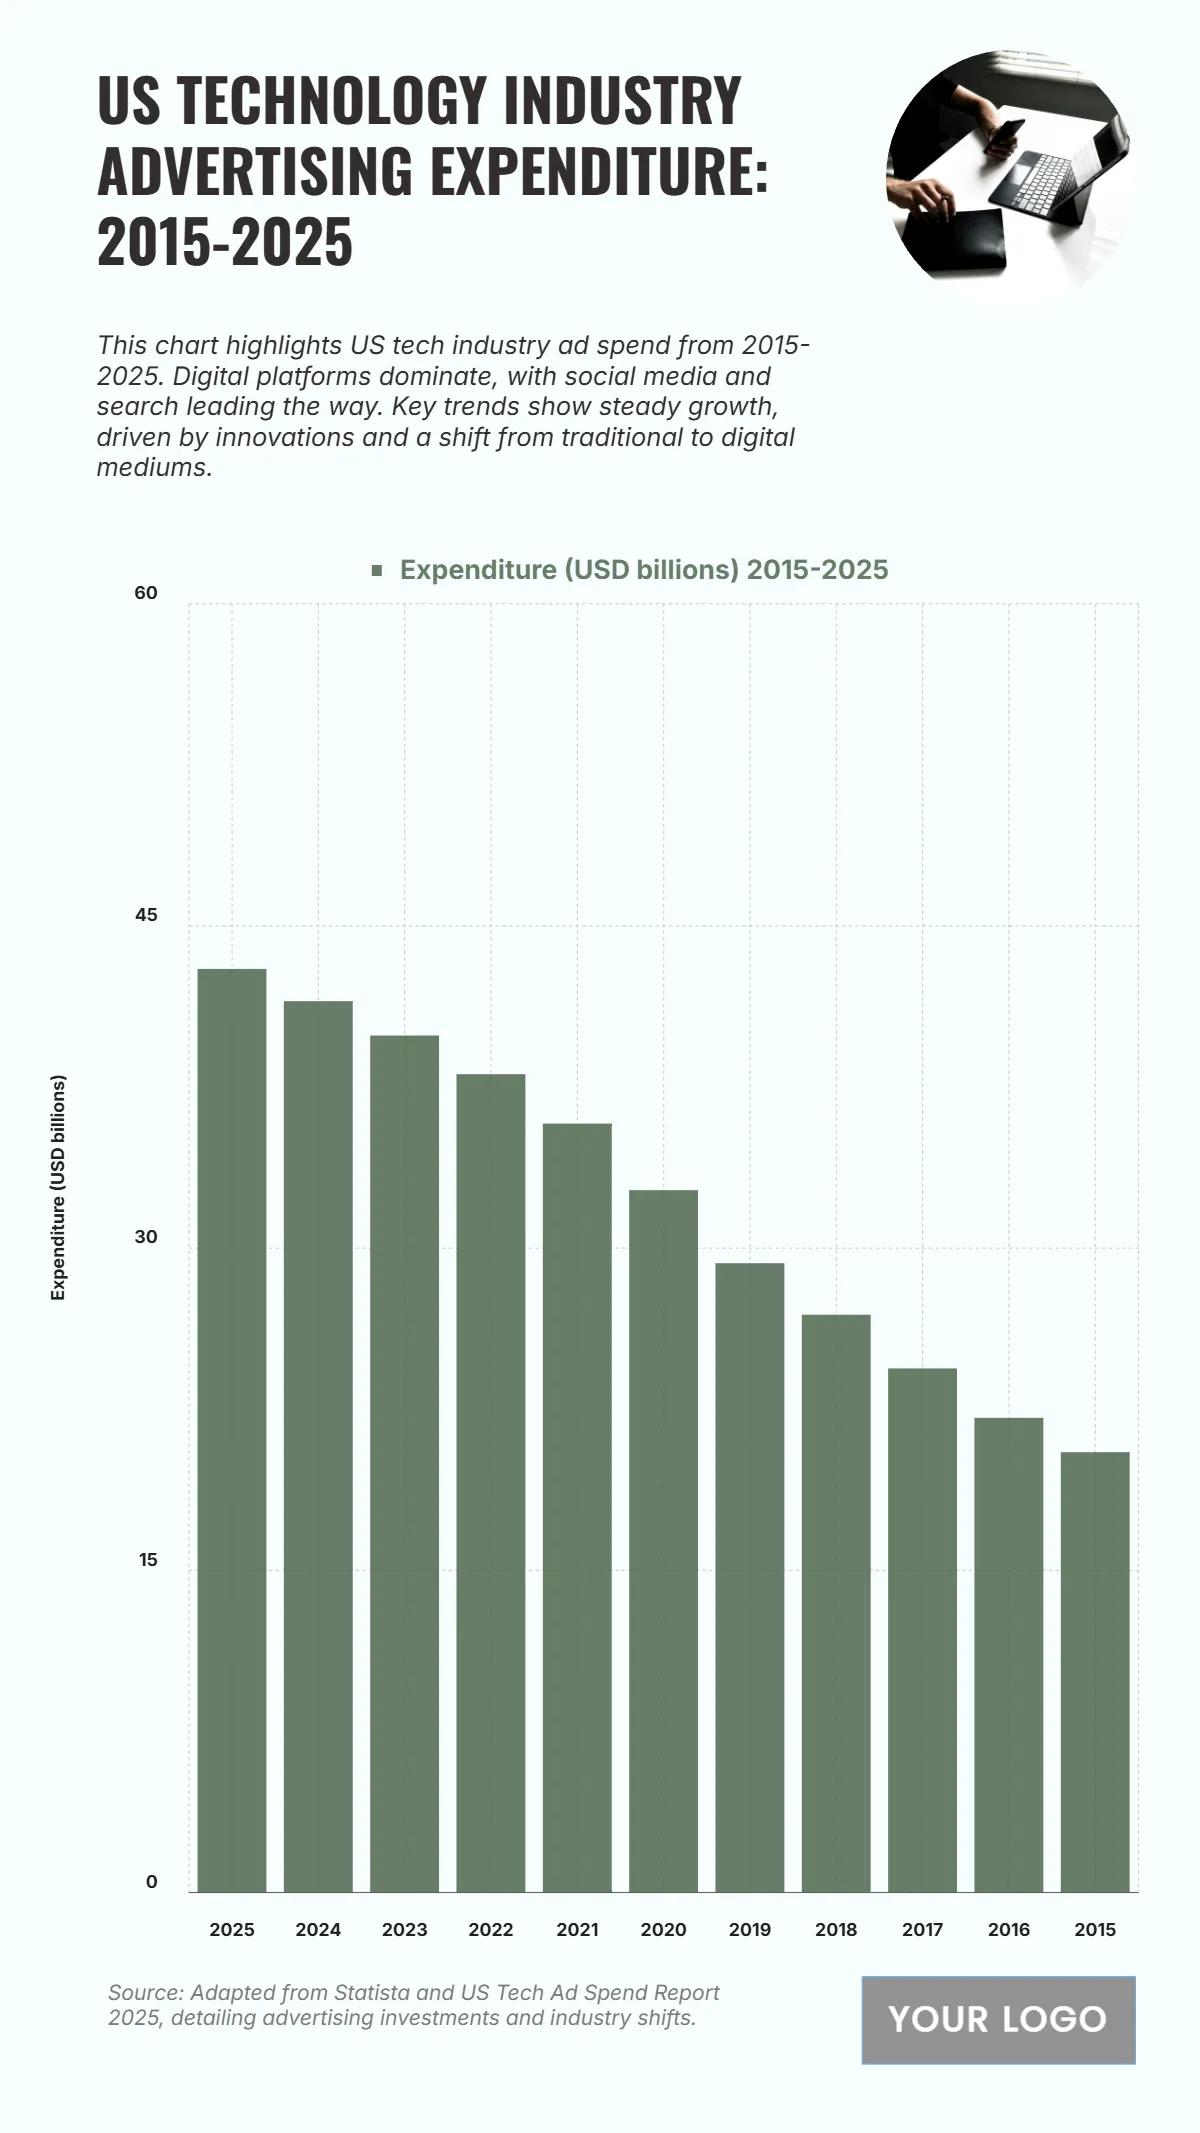
Free US Technology Industry Advertising Expenditure from 2015 to 2025 Chart
The chart shows the consistent rise in US Technology Industry Advertising Expenditure from 2015 to 2025, underlining the sector’s increasing digital focus and innovation-driven marketing strategies. Starting at USD 20.5 billion in 2015, spending grew gradually to USD 22.1 billion in 2016 and USD 24.4 billion in 2017, as digital transformation gained momentum. By 2018, expenditure reached USD 26.9 billion, rising further to USD 29.3 billion in 2019 and USD 32.7 billion in 2020, supported by expanded online campaigns. The growth trend continued through 2021 at USD 35.8 billion and 2022 at USD 38.1 billion, fueled by advancements in social media and search advertising. Spending surged to USD 39.9 billion in 2023, then USD 41.5 billion in 2024, and is projected to peak at USD 43 billion in 2025. This steady climb reflects the tech sector’s prioritization of digital marketing channels to capture expanding online audiences.
| Labels | Expenditure (USD billions) 2015–2025 |
|---|---|
| 2025 | 43 |
| 2024 | 41.5 |
| 2023 | 39.9 |
| 2022 | 38.1 |
| 2021 | 35.8 |
| 2020 | 32.7 |
| 2019 | 29.3 |
| 2018 | 26.9 |
| 2017 | 24.4 |
| 2016 | 22.1 |
| 2015 | 20.5 |


