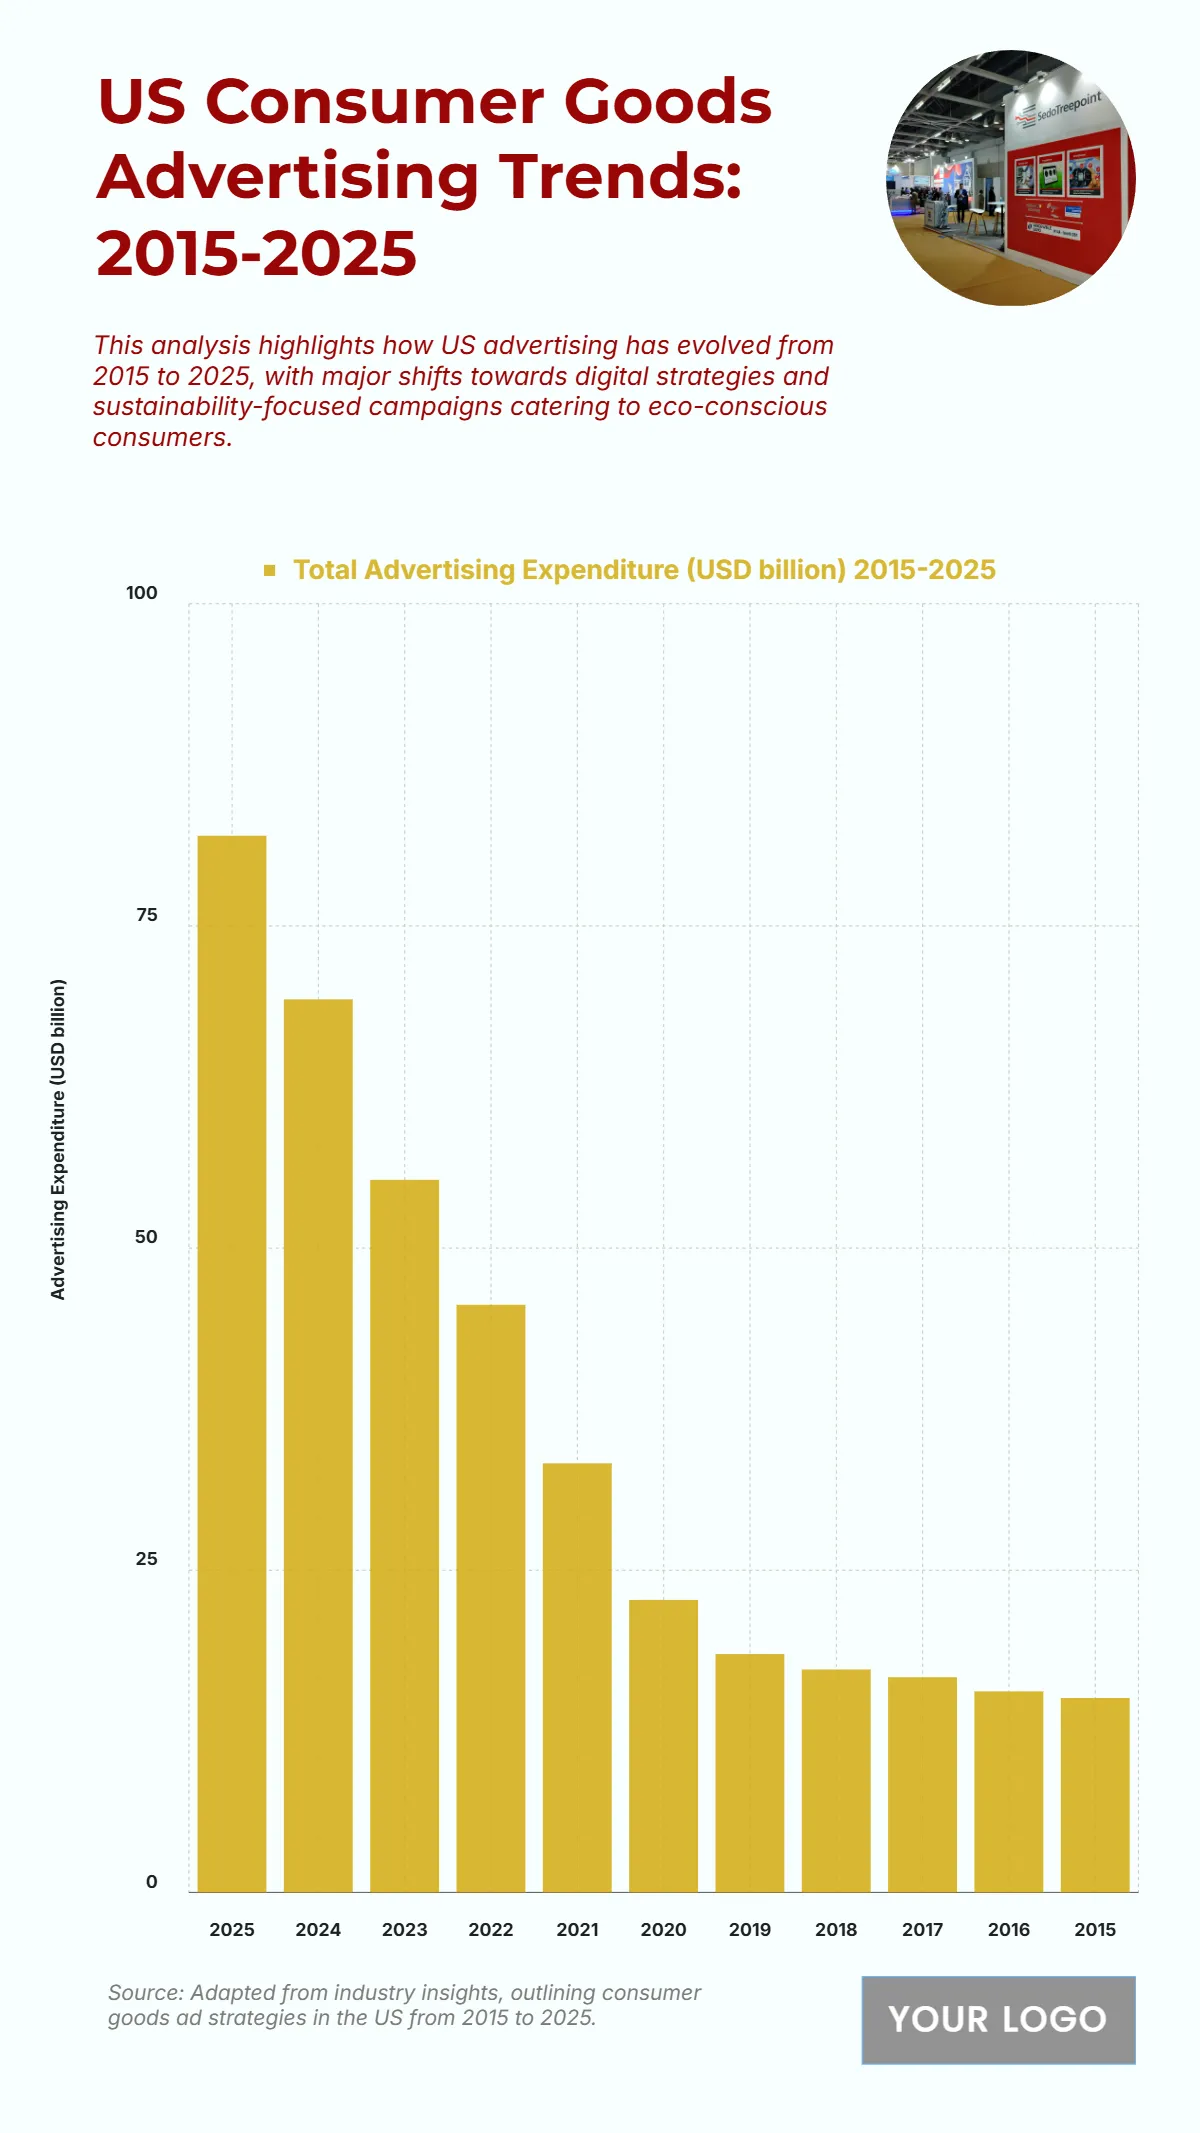
Free US Consumer Goods Advertising Trends from 2015 to 2025 Chart
The chart depicts the steady rise in US Consumer Goods Advertising Expenditure from 2015 to 2025, reflecting the industry’s shift toward digital innovation and sustainability-focused marketing. Starting at USD 15.09 billion in 2015, spending experienced gradual growth to USD 15.6 billion in 2016 and USD 16.7 billion in 2017, followed by a more pronounced rise to USD 17.3 billion in 2018 and USD 18.5 billion in 2019. The pace accelerated significantly in 2020, with expenditures reaching USD 22.7 billion, then climbing to USD 33.3 billion in 2021 and USD 45.6 billion in 2022, as brands increasingly adopted online platforms. By 2023, ad spending surged to USD 55.3 billion, followed by USD 69.3 billion in 2024, and is projected to peak at USD 82 billion in 2025. This near fivefold increase over a decade highlights the expanding influence of digital and eco-conscious advertising strategies in the consumer goods sector.
| Labels | Total Advertising Expenditure (USD billion) 2015–2025 |
|---|---|
| 2025 | 82 |
| 2024 | 69.3 |
| 2023 | 55.3 |
| 2022 | 45.6 |
| 2021 | 33.3 |
| 2020 | 22.7 |
| 2019 | 18.5 |
| 2018 | 17.3 |
| 2017 | 16.7 |
| 2016 | 15.6 |
| 2015 | 15.09 |


