Free US Regional Advertising Spend by State from 2015 to 2025 Chart
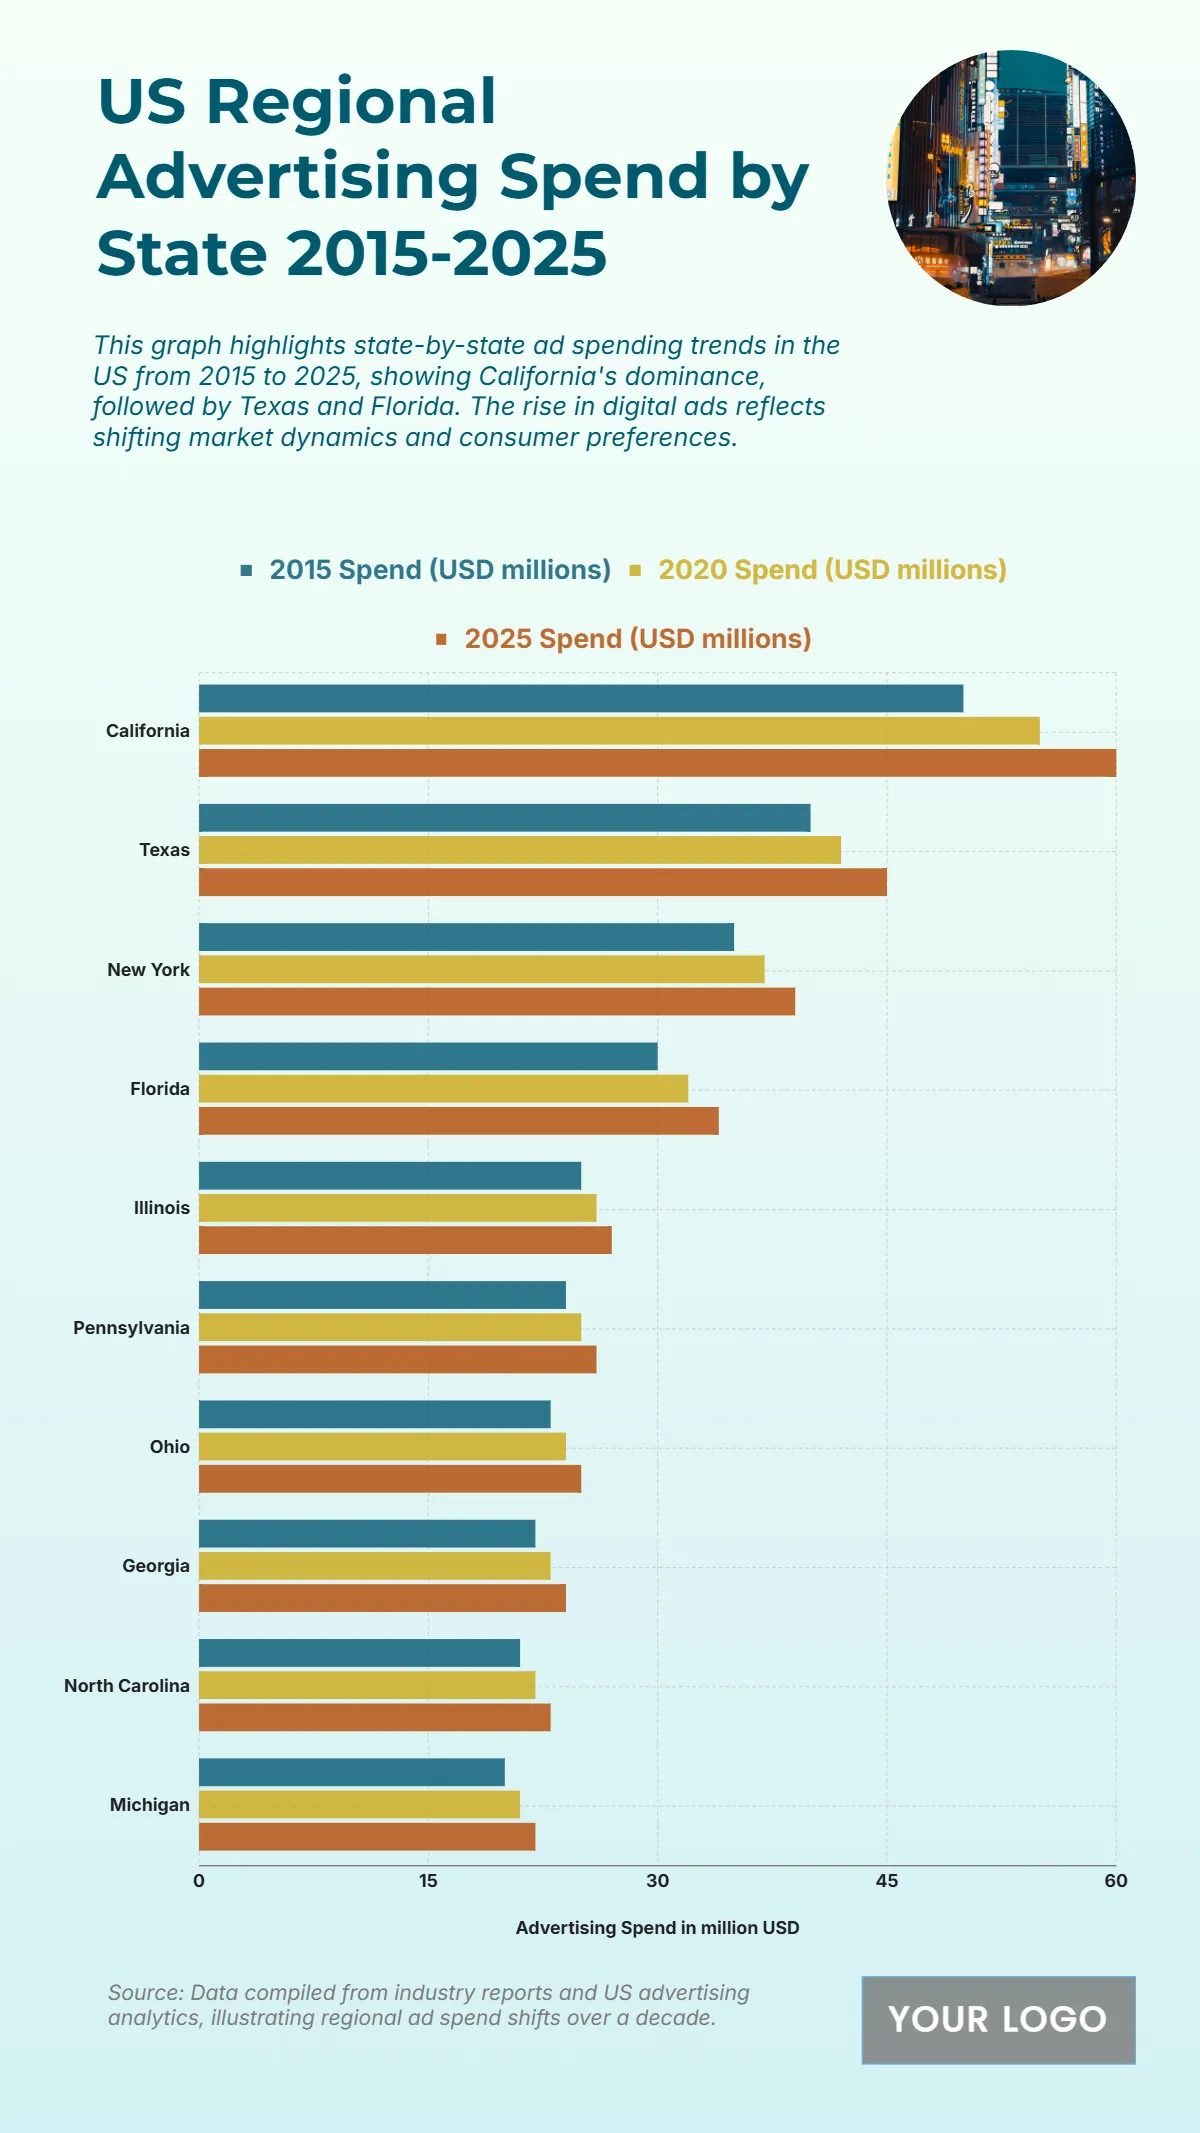
The chart illustrates regional advertising spending across major US states from 2015 to 2025, revealing consistent growth led by California, which rises from USD 50 million in 2015 to USD 55 million in 2020 and reaches USD 60 million by 2025. Texas follows as the second-largest market, increasing from USD 40 million to USD 45 million over the same period. New York maintains a strong presence, growing from USD 35 million in 2015 to USD 39 million in 2025. Meanwhile, Florida expands from USD 30 million to USD 34 million, and Illinois advances from USD 25 million to USD 27 million. Smaller but steady increases are also seen in Pennsylvania (USD 24M to 26M), Ohio (USD 23M to 25M), Georgia (USD 22M to 24M), North Carolina (USD 21M to 23M), and Michigan (USD 20M to 22M). The overall trend underscores steady regional investment and digital transformation across advertising markets.
| Labels | 2015 Spend (USD millions) | 2020 Spend (USD millions) | 2025 Spend (USD millions) |
|---|---|---|---|
| California | 50 | 55 | 60 |
| Texas | 40 | 42 | 45 |
| New York | 35 | 37 | 39 |
| Florida | 30 | 32 | 34 |
| Illinois | 25 | 26 | 27 |
| Pennsylvania | 24 | 25 | 26 |
| Ohio | 23 | 24 | 25 |
| Georgia | 22 | 23 | 24 |
| North Carolina | 21 | 22 | 23 |
| Michigan | 20 | 21 | 22 |


