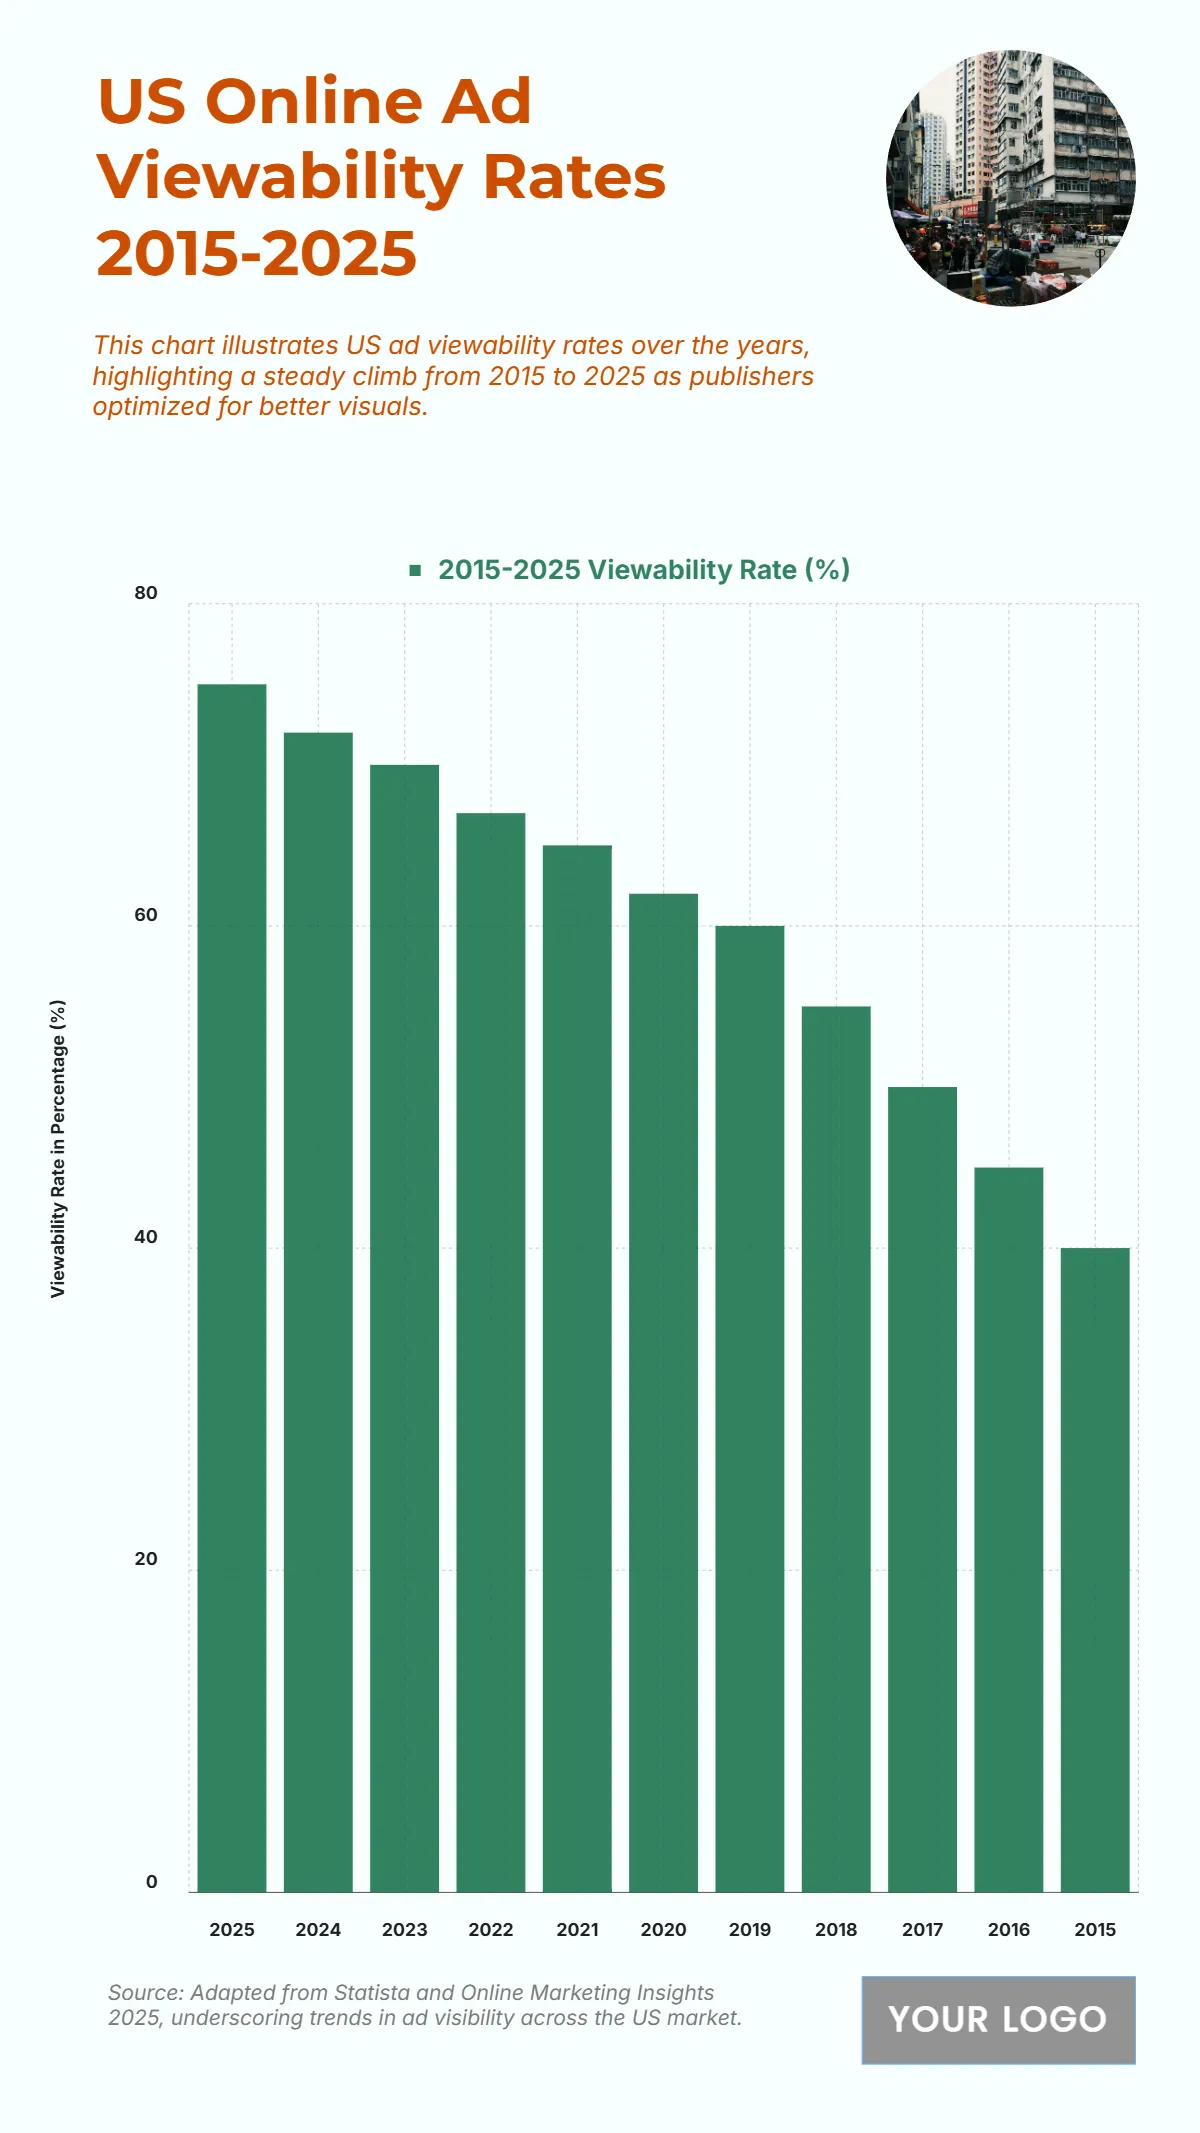
Free US Online Ad Viewability Rates from 2015 to 2025 Chart
The chart shows a consistent upward trend in US online ad viewability rates from 2015 to 2025, reflecting improvements in ad visibility and optimization for user engagement. In 2015, viewability stood at 40%, gradually climbing to 45% in 2016, 50% in 2017, and 55% in 2018 as advertisers refined display formats. The rate further improved to 60% by 2019, reaching 63% in 2020 and 67% in 2021, indicating stronger ad placement and tracking technologies. By 2022, viewability advanced to 70%, then 73% in 2023, and 76% in 2024, marking a shift toward data-driven ad performance optimization. The highest rate of 78% is recorded in 2025, demonstrating the industry’s success in improving ad visibility through better targeting, responsive design, and technological integration. Overall, the steady rise highlights how enhanced user experience, digital innovation, and analytics have significantly boosted ad visibility across online platforms.
| Labels | 2015–2025 Viewability Rate (%) |
|---|---|
| 2025 | 75 |
| 2024 | 72 |
| 2023 | 70 |
| 2022 | 67 |
| 2021 | 65 |
| 2020 | 62 |
| 2019 | 60 |
| 2018 | 55 |
| 2017 | 50 |
| 2016 | 45 |
| 2015 | 40 |


