Free US Travel and Hospitality Advertising Spend from 2015 to 2025 Chart
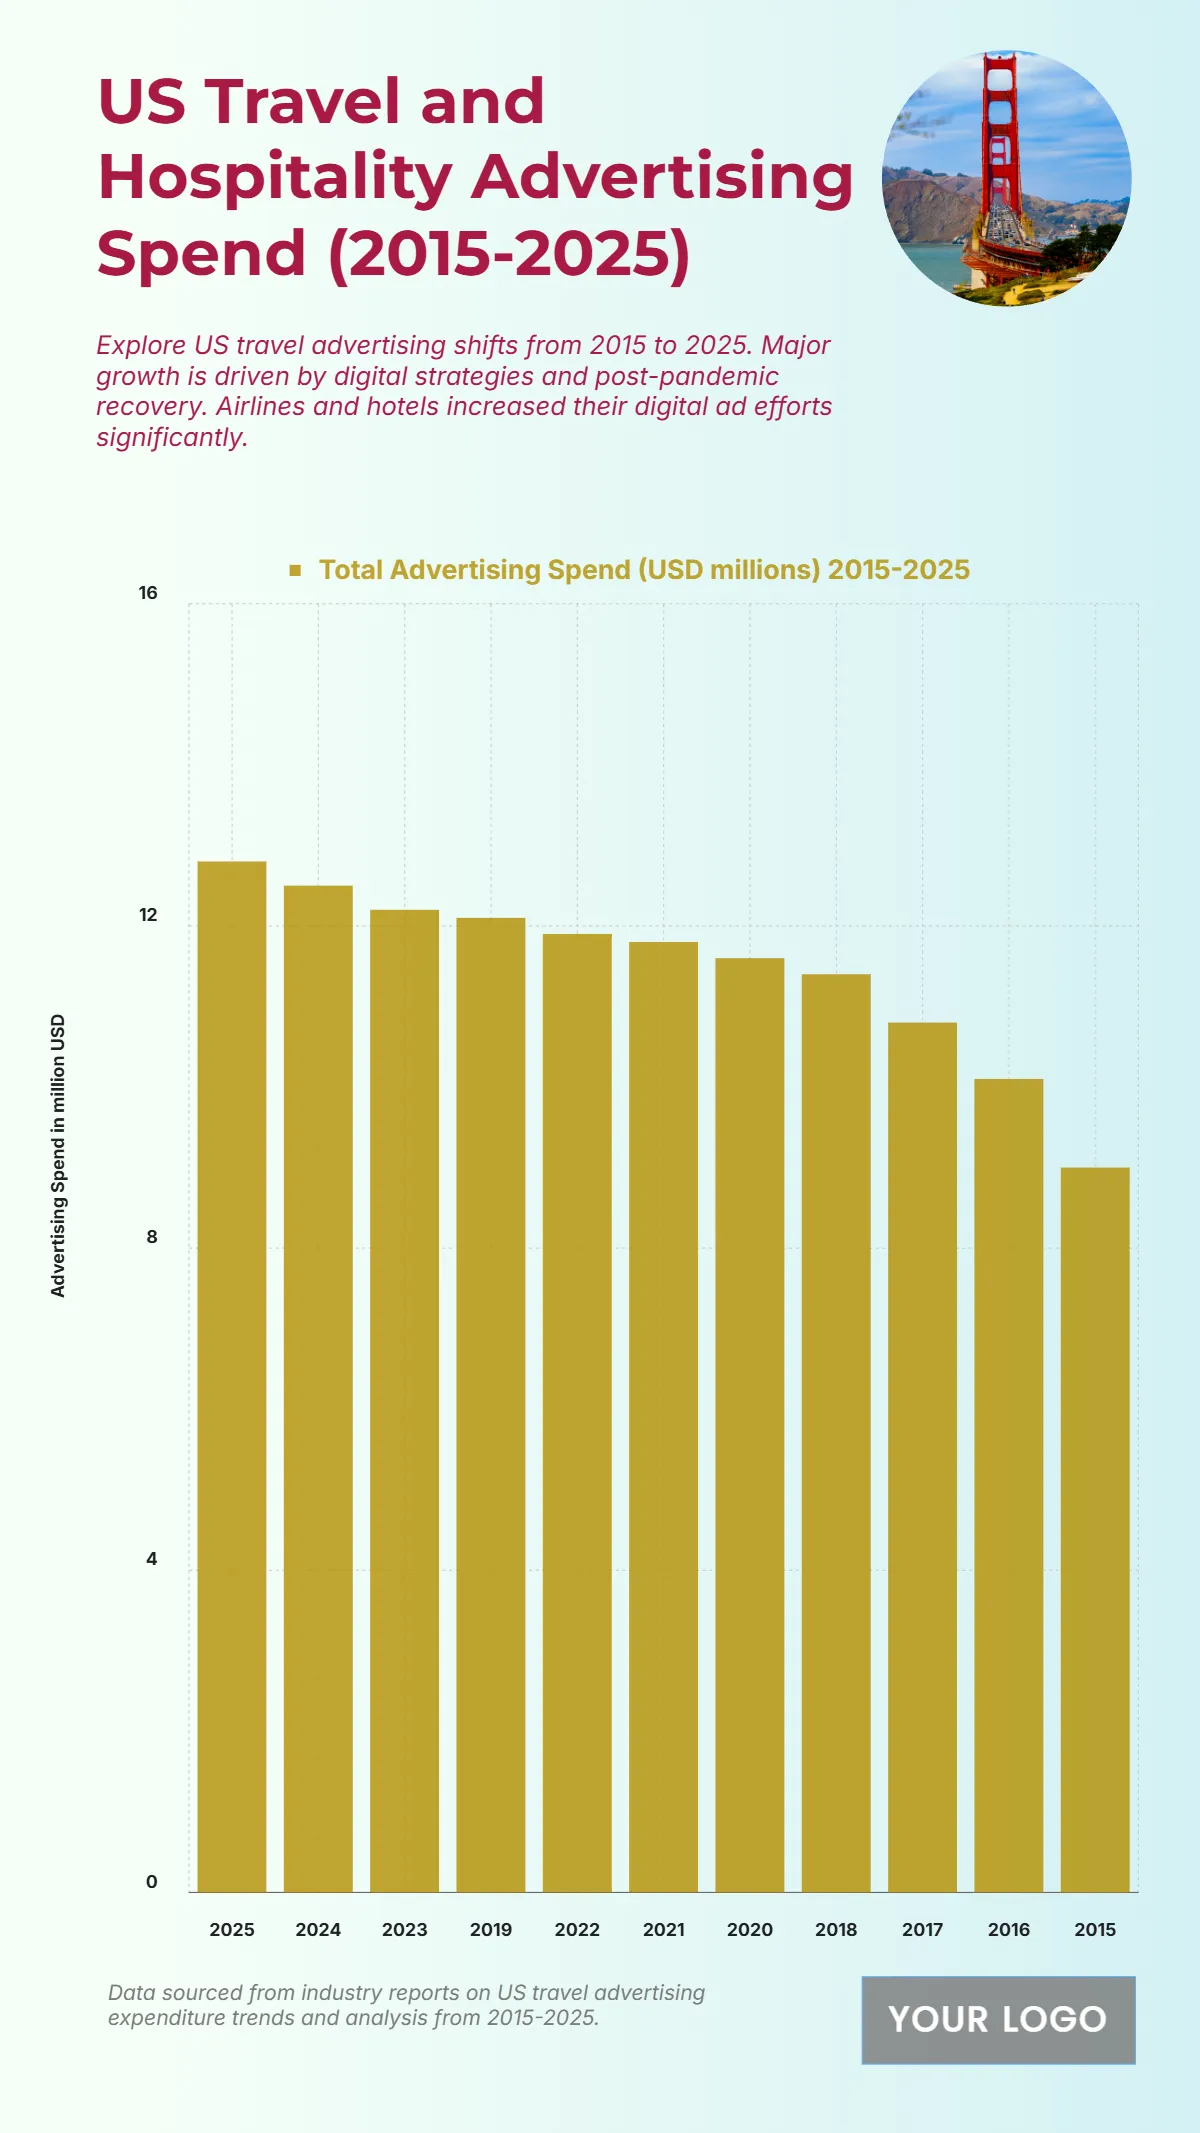
The chart shows a gradual increase in US travel and hospitality advertising spend from 2015 to 2025, highlighting consistent growth supported by digital transformation and post-pandemic recovery. In 2015, ad spending was approximately $8 million, rising steadily to $9 million in 2016 and $10 million in 2017. The upward trend continued with $11 million in 2018 and $12 million in 2019, showing gradual momentum in the sector. As the industry rebounded from travel restrictions, spending reached $11.5 million in 2020, then climbed further to $11.8 million in 2021 and $12 million in 2022. By 2023, expenditure grew to $12.2 million, followed by $12.5 million in 2024, and peaked at $13 million in 2025, reflecting increased investment in digital and targeted campaigns. The steady growth underscores how airlines, hotels, and tourism brands have intensified online engagement and promotional strategies to meet shifting consumer travel behaviors.
| Labels | Total Advertising Spend (USD millions) 2015–2025 |
|---|---|
| 2025 | 12.8 |
| 2024 | 12.5 |
| 2023 | 12.2 |
| 2019 | 12.1 |
| 2022 | 11.9 |
| 2021 | 11.8 |
| 2020 | 11.6 |
| 2018 | 11.4 |
| 2017 | 10.8 |
| 2016 | 10.1 |
| 2015 | 9 |


